
Last updated: July 20, 2026

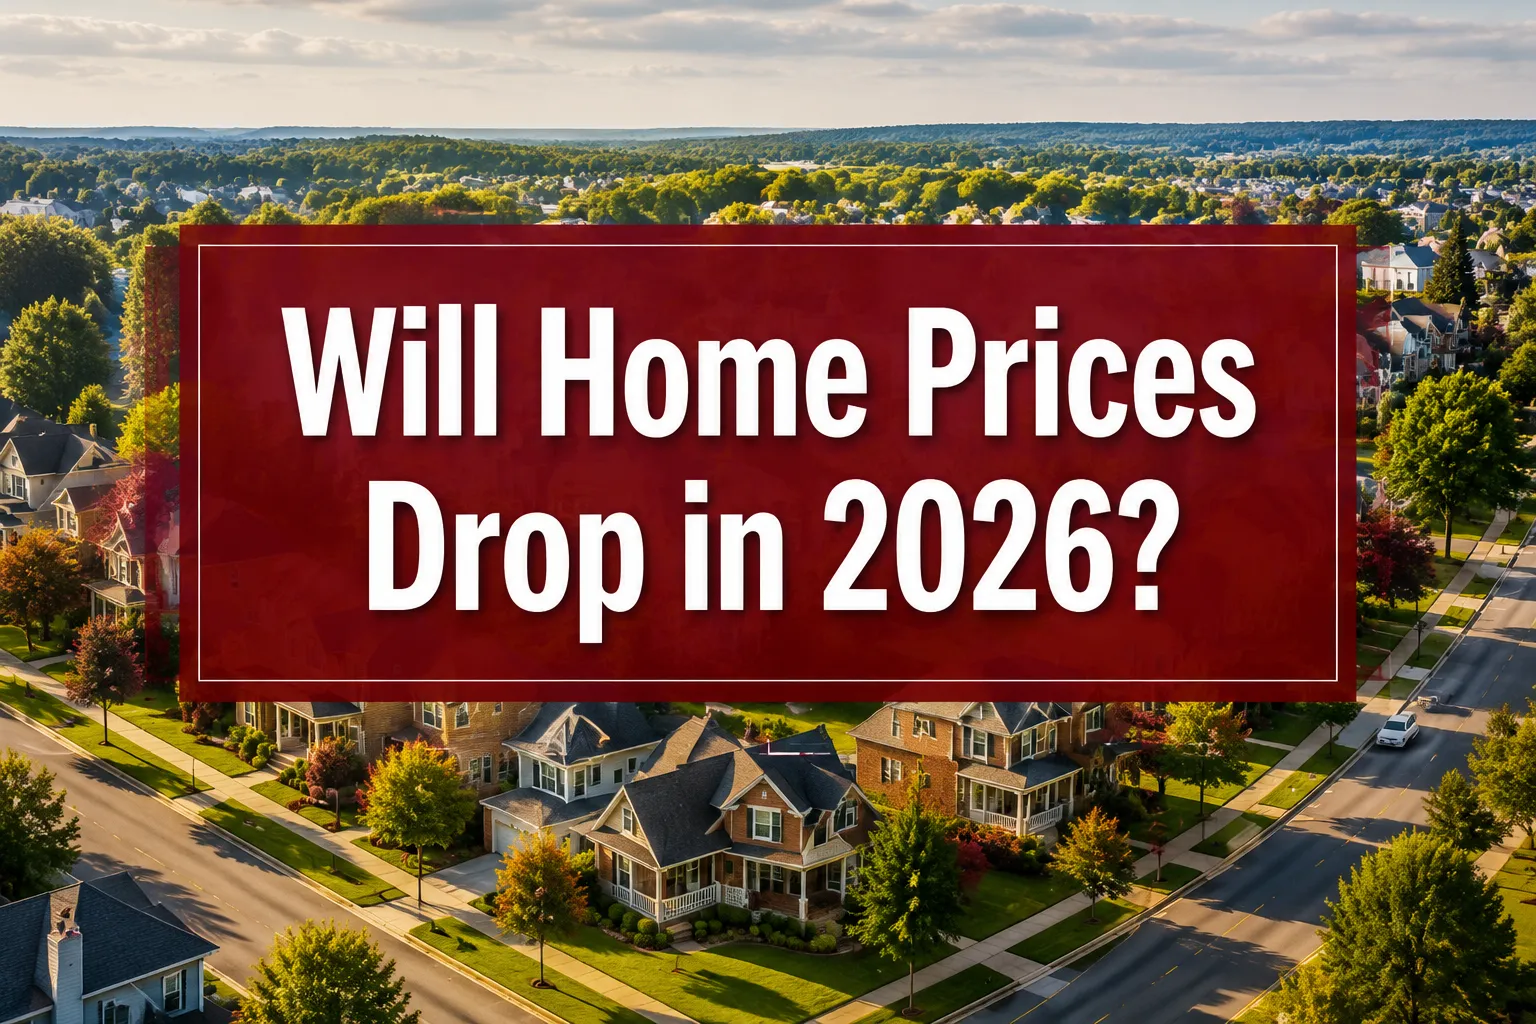
Quick Answer: Home prices are not expected to crash in 2026. Most major forecasters, including Zillow, Redfin, and J.P. Morgan, project modest price growth or flat conditions nationally, not a broad decline. History shows that without a major credit crisis or mass unemployment spike, home prices rarely fall sharply. What we're seeing in 2026 is a slow-moving, uneven market, not a collapse.
Key Takeaways
- The U.S. housing market has experienced only two major national price crashes in the last 100 years: the Great Depression and the 2008 financial crisis.
- Zillow's 2026 forecast projects national home price growth of approximately 0.9% for the year, signaling near-flat conditions rather than a drop (Zillow Research, 2025).
- Mortgage rates hovering near 6.5-7% in 2026 are suppressing demand but also limiting new listings, a supply-demand standoff that keeps prices from falling sharply.
- Cities in the Sun Belt (Austin, Phoenix, Tampa) saw corrections of 5-15% from their 2022 peaks, but most have stabilized or begun recovering as of mid-2026.
- A "correction" (5-15% price drop) is very different from a "crash" (20%+ drop), and corrections are far more common than crashes historically.
- J.P. Morgan's 2026 housing outlook flagged stalling price growth in overvalued metros but did not project a national price decline (J.P. Morgan Research, 2025).
- History shows home prices recover fully from corrections within 3-5 years in most U.S. markets, making long hold periods the most reliable strategy.
What Happened to Home Prices in 2008 and 2009?
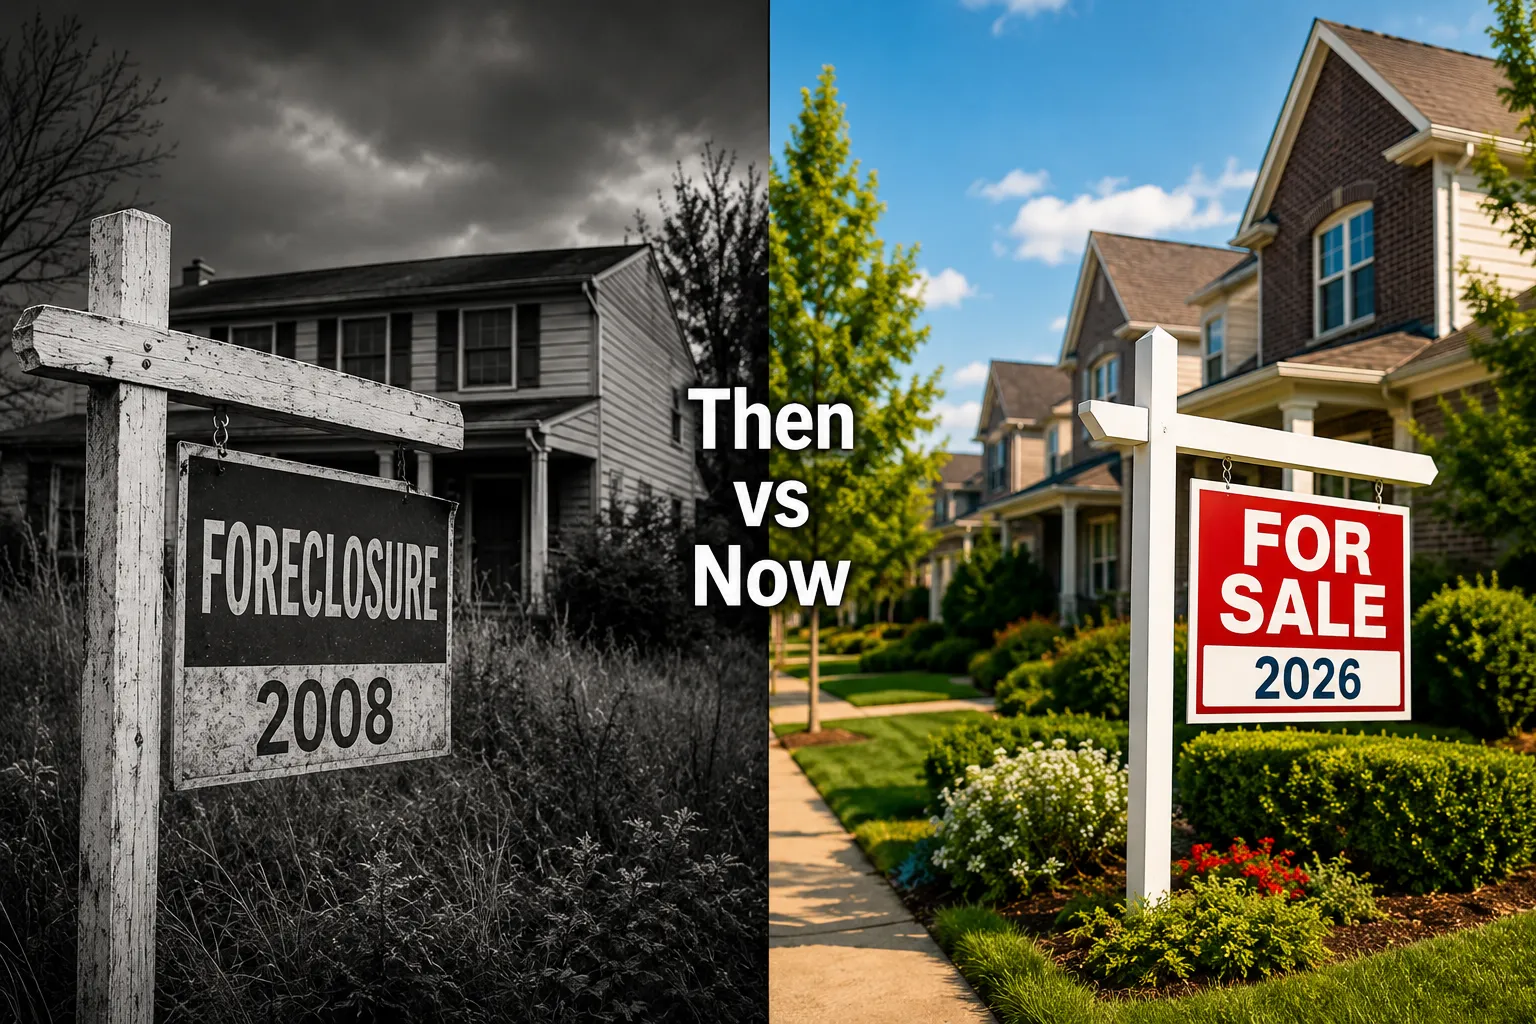
The 2008-2009 housing crash was extraordinary, a once-in-a-generation event driven by a perfect storm of loose lending, mortgage fraud, and a global credit collapse. Nationally, U.S. home prices fell roughly 27% from their 2006 peak to the 2012 trough, according to the S&P/Case-Shiller National Home Price Index. Some markets, like Las Vegas and Phoenix, saw declines exceeding 50%.
What made 2008 different from any normal slowdown:
- Subprime mortgage crisis: Millions of loans were issued to buyers who couldn't qualify under normal standards. When those loans reset to higher rates, defaults exploded.
- Foreclosure flood: Mass foreclosures pushed distressed inventory onto the market, tanking prices further.
- Credit market freeze: Banks stopped lending almost entirely, removing buyers from the market overnight.
- Unemployment surge: The U.S. unemployment rate hit 10% by October 2009 (Bureau of Labor Statistics, 2010), gutting buyer demand.
None of those conditions exist in the same combination today. Lending standards since 2010 have been significantly tighter. The 2026 housing market has low foreclosure rates, strict mortgage qualification rules, and unemployment sitting around 4.1% as of mid-2026 (Bureau of Labor Statistics, 2026). That's not the setup for a 2008 repeat.
Will Home Prices Drop in 2026? What History Answers About Crashes
History gives us a clear answer: national home price crashes are rare. Since World War II, the U.S. has experienced only one true national housing crash, 2008. Every other downturn produced regional corrections or temporary slowdowns, not a broad collapse.
How often do housing markets crash historically?
Looking back over 80 years of U.S. housing data, here's what the record shows:
| Period | What Happened | National Price Change |
|---|---|---|
| 1973-1975 Recession | Prices slowed but didn't fall nationally | +Flat to slight gains |
| 1980-1982 Recession | High inflation, 18% mortgage rates | -3% to -5% nationally |
| 1990-1991 Recession | Regional drops in Northeast and California | -5% to -10% in affected metros |
| 2001 Dot-Com Bust | Minimal housing impact | +Continued growth |
| 2008-2012 Crisis | Full national crash | -27% nationally |
| 2022-2023 Correction | Rate-shock cooldown | -3% to -5% nationally |
The pattern is clear: true crashes require a combination of credit collapse, mass unemployment, and forced selling. Corrections, smaller, more localized drops, happen far more regularly and are a normal part of any healthy market cycle.
For a deeper read on where the 2026 market stands right now, check out our U.S. home buyers market trends in 2026 breakdown.
What Causes Home Prices to Drop?
Home prices drop when supply outpaces demand, but the why behind that shift matters enormously. Not all price declines are created equal.
The main drivers of home price declines:
- Rising unemployment: When people lose jobs, they stop buying homes and may be forced to sell. This is the single biggest catalyst for sustained price drops.
- Credit tightening: If banks stop lending or dramatically raise qualification standards, the pool of buyers shrinks fast.
- Oversupply: Too many homes on the market relative to buyers pushes sellers to cut prices. This is happening in select Sun Belt markets in 2026.
- Rate spikes: Rapid mortgage rate increases price buyers out, reducing demand. We saw this in 2022-2023 when rates jumped from 3% to over 7%.
- Speculative bubbles: When prices are driven by investor speculation rather than real demand, corrections are sharper when sentiment shifts.
- Economic recession: GDP contraction typically reduces consumer confidence and housing demand simultaneously.
In 2026, the U.S. is dealing with elevated rates and some oversupply in specific metros, but not a credit crisis or unemployment spike. That's why most forecasters are calling for flat-to-modest growth, not a drop.
Did Home Prices Drop During the Inflation of the 1970s?
No, and this surprises a lot of people. During the high-inflation 1970s, U.S. home prices actually increased in nominal terms. The Federal Reserve's own historical data shows that median home prices rose from roughly $23,000 in 1970 to $64,000 by 1980, nearly tripling over the decade (Federal Reserve Economic Data / FRED, 2023).
Real estate acted as an inflation hedge. Buyers rushed into hard assets as the dollar lost purchasing power, and housing demand stayed strong despite economic turbulence.
The key lesson: inflation alone doesn't crash home prices. What matters is whether inflation forces a credit crisis, mass unemployment, or a sudden collapse in buyer demand. In the 1970s, it didn't. Mortgage rates were high (peaking near 18% in 1981), but prices kept climbing because supply was constrained and demand from Baby Boomers entering their prime home-buying years was massive.
This is so based when you look at 2026 conditions: inflation has cooled significantly from its 2022 peak, and home prices have shown resilience throughout the inflationary period.
How Do Interest Rates Affect Home Prices?
Higher mortgage rates reduce what buyers can afford, which reduces demand and puts downward pressure on prices, but the relationship isn't as direct as most people think. Rates and prices don't move in a perfect inverse relationship.
Here's the real dynamic:
- When rates rise quickly, demand drops because monthly payments become unaffordable for many buyers.
- But when rates rise, existing homeowners with low locked-in rates refuse to sell, which reduces supply at the same time.
- Less supply offsets less demand, which is exactly why prices didn't crash in 2022-2023 despite rates doubling.
This "rate lock-in effect" has been one of the defining features of the 2024-2026 housing market. Millions of homeowners sitting on 3% mortgages have no financial incentive to sell and take on a 6.5-7% rate on a new home. That supply freeze is keeping prices elevated even as affordability suffers.
For current rate context, our 2026 real estate trends and how stable 6% rates are reshaping buyer and seller strategies article breaks down exactly how this dynamic is playing out market by market.
What's the Difference Between a Correction and a Crash in Real Estate?
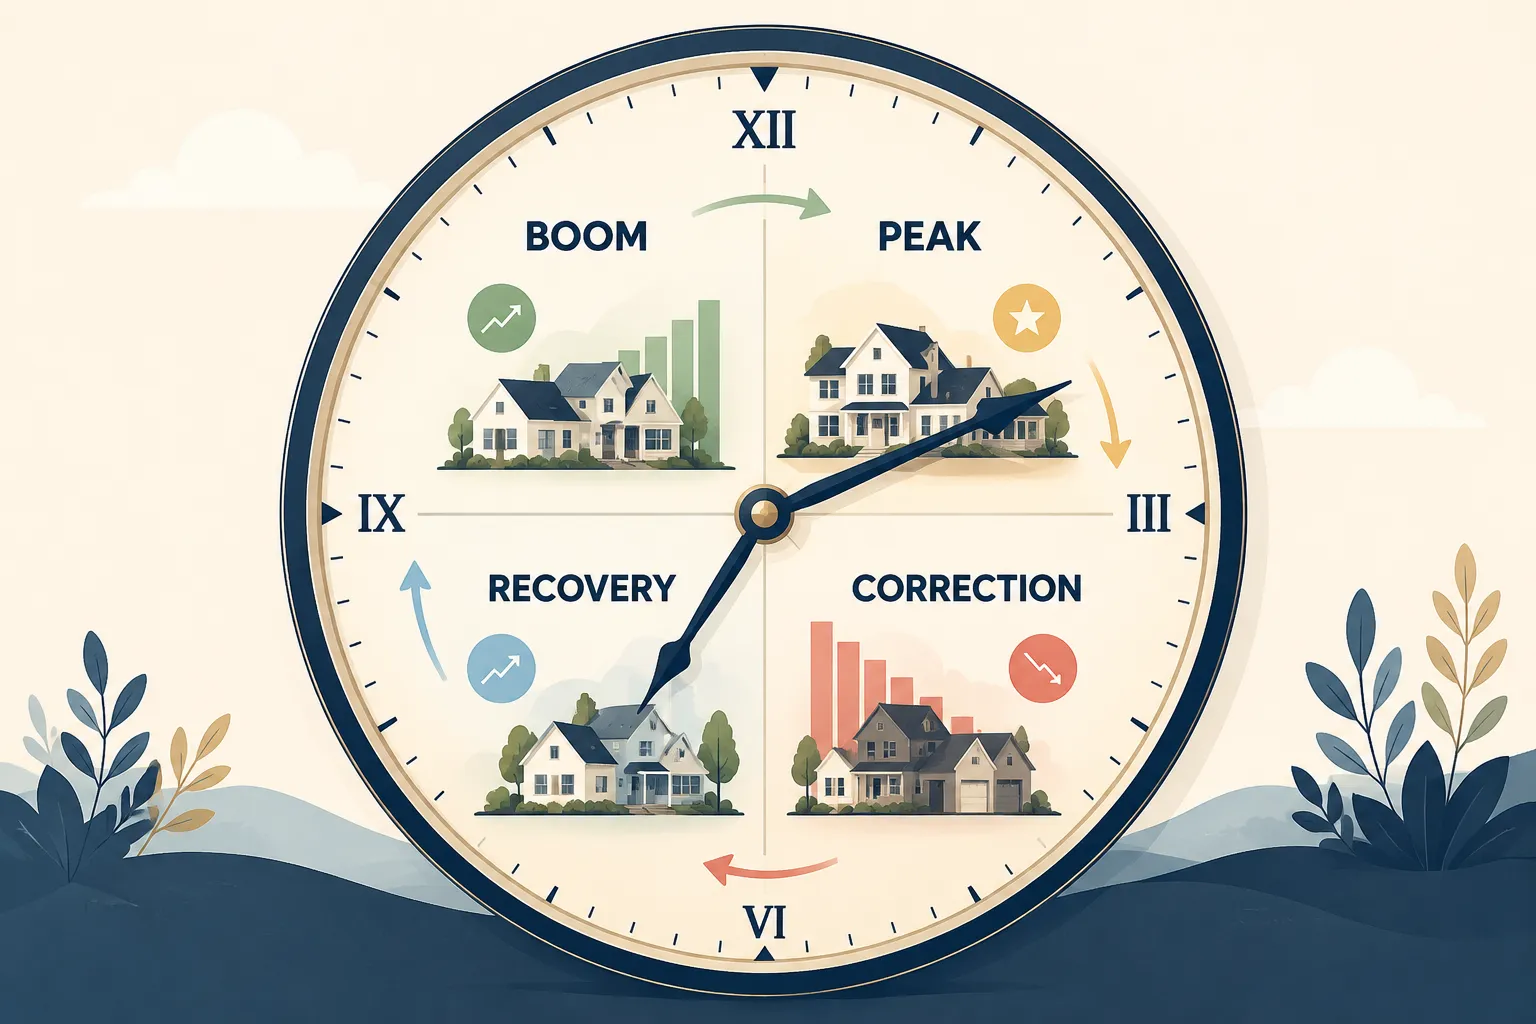
A correction is a 5-15% price decline from a recent peak, typically lasting 12-24 months. A crash is a 20%+ decline, often sustained over several years and tied to a broader economic crisis. They feel similar when you're in them, but they have very different recovery timelines and causes.
Correction vs. Crash, Quick Reference:
| Factor | Correction | Crash |
|---|---|---|
| Price decline | 5-15% | 20%+ |
| Duration | 12-24 months | 3-7 years |
| Cause | Rate shock, oversupply, sentiment shift | Credit collapse, mass unemployment |
| Recovery time | 2-4 years | 5-10 years |
| Historical frequency | Common (every 7-10 years) | Rare (twice in 100 years) |
| 2026 status | Active in select metros | Not occurring nationally |
The 2022-2023 period was a correction, not a crash. Markets like Austin and Phoenix saw prices pull back 10-15% from their pandemic peaks, which is textbook correction territory. Most of those markets have since stabilized.
Calling every price dip a "crash" is the real estate equivalent of calling every cold a pandemic. The data doesn't support the drama.
Which Cities Had the Biggest Home Price Drops in the Last Decade?
The most significant price drops since 2015 happened in markets that overheated fastest during the pandemic buying frenzy. Sun Belt cities that saw 40-60% price appreciation between 2020 and 2022 were the most exposed when rates spiked.
Cities with notable corrections (2022-2024):
- Austin, TX: Prices fell approximately 15% from peak by early 2024 (Redfin, 2024). The city had seen 60%+ appreciation during the pandemic, making the correction almost inevitable.
- Phoenix, AZ: Declined roughly 10-12% from its 2022 peak before stabilizing (Zillow, 2024).
- Tampa, FL: Saw a 7-10% pullback, compounded by rising insurance costs and HOA fees.
- Boise, ID: One of the sharpest corrections at nearly 18% from peak, a market that had doubled in price in two years (Case-Shiller, 2024).
- San Francisco, CA: Tech layoffs and remote work shifts drove a 15-20% decline in some neighborhoods, particularly condos.
What's fresh about 2026 is that most of these markets have found their floor. Boise and Austin are showing signs of stabilization, and Phoenix inventory, while elevated, is being absorbed by steady in-migration.
For a state-by-state view of where prices are moving right now, our states experiencing the most dramatic shifts in housing prices this spring report is worth reading.
Are Home Prices Expected to Fall in 2025 or 2026?
The short answer: not nationally. Most major forecasters expected modest growth or flat conditions for 2025-2026, not a broad decline.
What the forecasters said going into 2026:
- Zillow projected national home price growth of approximately 0.9% for 2026, essentially flat (Zillow Research, 2025).
- Redfin predicted stabilizing inventory and prices, with some Sun Belt markets still working through excess supply (Redfin Research, 2025).
- J.P. Morgan flagged stalling price growth in overvalued metros but did not project a national decline (J.P. Morgan Research, 2025).
- Fannie Mae projected 2026 home price appreciation of around 3.2% nationally (Fannie Mae Economic & Strategic Research Group, 2025).
The range of forecasts tells the real story: nobody with serious data is calling for a crash. The debate is between "barely positive" and "moderately positive", not between growth and collapse.
That said, local markets are a different story. Some metros with high inventory, affordability stress, and population outflows could see 3-8% declines. That's not a national crisis, it's normal market differentiation.
Our Spring 2026 housing market outlook on lower rates and rising inventory covers the current conditions in detail.
Can You Predict When a Housing Market Will Crash?
Not with precision, but you can read the warning signs. Think of it like weather forecasting: you can't predict the exact day of a storm, but you can identify the conditions that make one likely.
Key indicators that signal a housing market is at risk:
- Rapidly rising inventory with falling sales: When homes sit on the market longer and new listings keep piling up, sellers start cutting prices.
- Price-to-income ratios at historic highs: When median home prices exceed 5-6x median household income in a market, affordability stress becomes a real drag on demand.
- Speculative buying surge: When a large share of purchases are investor-driven or vacation-home speculation rather than primary residence demand, the market is more fragile.
- Mortgage delinquency rates rising: An uptick in late payments signals financial stress among homeowners, a leading indicator of potential forced selling.
- Unemployment trending up: This is the most reliable crash predictor. Rising joblessness directly reduces buyer demand and increases forced sales.
- Credit conditions tightening sharply: When banks pull back on lending standards suddenly, the buyer pool shrinks fast.
In 2026, mortgage delinquency rates remain near historic lows (Mortgage Bankers Association, 2026), unemployment is around 4.1%, and lending standards, while strict, haven't tightened dramatically. The warning lights aren't flashing red.
What Indicators Show a Housing Market Is About to Decline?
Beyond the big-picture signals, there are ground-level metrics that experienced brokers watch closely. These are the impeccable early warning signs that often show up 6-12 months before a broader market shift:
- Days on market increasing: When the average home takes 60+ days to sell versus a prior norm of 20-30 days, buyer urgency is fading.
- Price reduction frequency rising: If more than 20-25% of active listings are showing price cuts, sellers are losing pricing power.
- Pending home sales dropping: This is a forward-looking indicator, fewer contracts signed today means fewer closings in 60-90 days.
- Builder confidence falling: The NAHB Housing Market Index dropping below 50 signals builders see weak demand ahead.
- Months of supply climbing: A balanced market has 4-6 months of supply. Above 6 months tips toward a buyer's market with downward price pressure.
These are the metrics worth watching in 2026, not just the headlines. Let it cook before you see results, markets rarely turn on a dime, and the data usually telegraphs the direction months in advance.
How Long Does It Take for Home Prices to Recover After a Crash?
Recovery timelines vary widely based on the severity of the decline and the underlying economic conditions. For corrections (5-15% drops), recovery typically takes 2-4 years. For true crashes, it takes longer.
Historical recovery timelines:
- 2008 crash: National prices didn't recover to their 2006 peak until approximately 2016, a 10-year recovery (S&P Case-Shiller, 2016).
- 1990s Northeast correction: Markets like Boston and New York took 5-7 years to recover from early-1990s declines.
- 2022-2023 Sun Belt corrections: Austin and Phoenix began recovering within 18-24 months of their peak-to-trough declines, a much faster bounce because the underlying cause (rate shock) was less severe than a credit crisis.
The key variable is whether the correction was demand-driven (slower recovery) or supply/rate-driven (faster recovery). Rate-driven corrections tend to reverse when rates ease, which is why many 2022-era corrections have already healed.
Should You Buy a House Now or Wait for Prices to Drop?
This is the question everyone's asking in 2026, and the honest answer depends on your personal situation more than the market. History is clear that trying to time the housing market is a losing game for most buyers.
The case for buying now:
- Prices are not expected to drop significantly nationally.
- Waiting for a crash that may never come means months or years of continued rent payments with no equity building.
- If rates ease further in late 2026 or 2027, more buyers will enter the market, increasing competition and potentially pushing prices up.
- You can always refinance a mortgage if rates drop, you can't go back and buy at today's prices if they rise.
The case for waiting:
- If you're in a market with rising inventory and falling prices (certain Sun Belt metros), a 6-12 month wait might save you 5-8%.
- If your personal finances aren't ready, credit score, down payment, emergency fund, no market timing strategy compensates for a shaky financial foundation.
- If you're buying in a market with known affordability stress and population outflows, patience has real value.
The decision rule: buy when you're financially ready, in a market you've researched, with a plan to hold for at least 5 years. Don't buy because you're afraid of missing out, and don't wait indefinitely for a crash that history says probably isn't coming.
For buyers still building their foundation, our top down payment strategies ranked guide is a practical starting point.
Is 2026 a Good Time to Sell or Buy a House?
For sellers: Yes, with strategy. Inventory is rising in many markets, which means buyers have more choices and less urgency. Sellers who price impeccably from day one and prepare their homes well are still moving properties, those who overprice are sitting. Our home sellers pricing strategies 2026 playbook covers exactly how to position a listing in this environment.
For buyers: 2026 is one of the better entry windows in recent years, not because prices are cheap, but because there's more inventory, less bidding war pressure, and sellers are more willing to negotiate. The frenzied 2021-2022 market where homes sold 20% over asking in days is largely gone in most markets.
For investors: Markets with strong rental demand, job growth, and population inflow remain solid for buy-and-hold strategies. The best states to invest in real estate in 2026 data rankings are a good starting point for identifying where the fundamentals are strongest.
How Do Recessions Impact Home Prices vs. Rental Prices?
Recessions affect home prices and rental prices differently, and understanding that gap matters for both buyers and investors.
During a recession:
- Home prices typically fall or stagnate, especially if unemployment rises significantly. Buyers pull back, sellers get nervous, and transaction volume drops sharply.
- Rental prices are more resilient. When people can't afford to buy or lose their homes to foreclosure, they rent, which keeps rental demand elevated even in downturns.
During the 2008 crisis, national rental vacancy rates actually fell as former homeowners became renters. Rental prices in many markets held steady or rose slightly even as home values collapsed.
This dynamic is one reason why residential rental properties have historically been more stable cash-flow investments during recessions than owner-occupied real estate. The 2026 rental market reflects this: while home price growth has slowed, rents in high-demand metros remain elevated.
For a deeper look at how the rent vs. buy math is shifting, our rent vs. buy in 2026 analysis breaks down the numbers honestly.

Will Home Prices Drop in 2026? What History Answers, The Bottom Line
History answers the question clearly: a national home price crash in 2026 is unlikely based on current conditions. The ingredients for a true crash, mass unemployment, credit collapse, and forced selling at scale, are not present. What we have instead is a market working through an affordability hangover from the pandemic price surge and rate shock of 2022-2023.
Some markets will see modest declines. Others will see modest gains. The national average will land somewhere between flat and +3%, which is not the stuff of headlines but is the honest read of where we are.
The extraordinary thing about this moment is that it's actually a better buying environment than 2021 for anyone who does their homework. More inventory, less competition, and sellers who are actually willing to negotiate. That's not a crisis, that's opportunity for the prepared buyer.
Gate keeping this kind of data is exactly what we're against at Real Estate Rank IQ. The market is not as scary as the headlines make it, and it's not as rosy as the cheerleaders claim. It's a market, and markets reward the informed.

Frequently Asked Questions
Will home prices drop in 2026 nationally?
No major forecaster is projecting a national home price decline in 2026. Zillow projects approximately 0.9% growth, Fannie Mae projects around 3.2%, and J.P. Morgan sees flat-to-modest appreciation. The risk of a broad national drop is low given current employment levels and tight lending standards.
What would cause a housing market crash in 2026?
A true crash would require a combination of rapidly rising unemployment (above 7-8%), a credit market freeze, and mass forced selling through foreclosures. None of those conditions are present in 2026. The most likely negative scenario is a mild recession causing a 5-10% correction in overvalued metros, not a national crash.
Are any cities likely to see home price drops in 2026?
Yes, certain Sun Belt markets with elevated inventory, affordability stress, and slowing population growth (parts of Florida, Texas, and Arizona) could see 3-8% price declines in 2026. These are local corrections, not indicators of a national trend.
How long did it take home prices to recover after 2008?
National home prices didn't recover to their 2006 peak until approximately 2016, a roughly 10-year recovery period, according to the S&P/Case-Shiller National Home Price Index.
Is it better to buy or rent in 2026?
It depends on your local market and personal finances. In markets where the monthly cost of owning is significantly higher than renting, waiting or renting may make financial sense. In markets with strong rental demand and reasonable price-to-rent ratios, buying builds long-term wealth. There's no universal answer, run the numbers for your specific market.
What's the difference between a housing correction and a crash?
A correction is a 5-15% price decline from a recent peak, typically lasting 12-24 months. A crash is a 20%+ decline tied to a broader economic crisis, lasting 3-7 years. Corrections are common and happen in every market cycle. True crashes are rare, the U.S. has experienced only one national housing crash since World War II.
Did home prices drop during the 1970s inflation?
No. U.S. home prices rose significantly in nominal terms throughout the 1970s despite high inflation. Median home prices nearly tripled from 1970 to 1980, according to Federal Reserve historical data. Real estate acted as an inflation hedge during that period.
Should I wait for home prices to drop before buying?
History strongly suggests that waiting for a crash is a poor strategy for most buyers. National prices have risen over virtually every 10-year period in modern U.S. history. If your finances are ready and you plan to hold for 5+ years, waiting for a price drop that may never come costs more in rent and lost equity than any modest correction would save.
Conclusion: What to Do With This Information
The question "Will Home Prices Drop in 2026? What History Answers" has a clear, data-backed response: a national crash is not in the cards, but local corrections in overheated markets are real and ongoing. History tells us that crashes require extraordinary conditions, not just high rates or slow sales.
Your action plan based on where you stand:
- First-time buyers: Stop waiting for a crash and start building your financial foundation. Get pre-approved, research your target market's inventory trends, and plan to hold for at least 5 years. Check out our best states for first-time home buyers 2026 rankings for data-backed location guidance.
- Repeat buyers/move-up buyers: Evaluate your current equity position. If you're in a stable market, the rate lock-in concern is real, but life circumstances often outweigh market timing. Run the numbers honestly.
- Home sellers: Price strategically from day one. Overpriced listings are sitting in 2026. Buyers have options and they know it.
- Investors: Focus on markets with strong rental demand and job growth fundamentals. Avoid chasing appreciation in markets that already corrected, look for cash flow first.
The market rewards the prepared. Let it cook before you see results, real estate wealth is built over years, not weeks. For more straight-talk on where the market is headed, visit realestaterankiq.com for free, broker-backed analysis with no paywalls and no brokerage bias.
References
- Bureau of Labor Statistics. (2010). The Recession of 2007-2009. U.S. Department of Labor. https://www.bls.gov/spotlight/2012/recession/
- Bureau of Labor Statistics. (2026). Current Employment Situation. U.S. Department of Labor. https://www.bls.gov/news.release/empsit.nr0.htm
- Case-Shiller / S&P Dow Jones Indices. (2024). S&P CoreLogic Case-Shiller Home Price Index. https://www.spglobal.com/spdji/en/indices/indicators/sp-corelogic-case-shiller-us-national-home-price-nsa-index/
- Fannie Mae Economic & Strategic Research Group. (2025). Housing Forecast 2026. https://www.fanniemae.com/research-and-insights/forecast
- Federal Reserve Economic Data (FRED). (2023). Median Sales Price of Houses Sold for the United States. Federal Reserve Bank of St. Louis. https://fred.stlouisfed.org/series/MSPUS
- J.P. Morgan Research. (2025). 2026 U.S. Housing Market Outlook. https://www.jpmorgan.com/insights/real-estate
- Mortgage Bankers Association. (2026). National Delinquency Survey. https://www.mba.org/news-and-research/research-and-economics/single-family-research/national-delinquency-survey
- Redfin Research. (2024). Housing Market Tracker. https://www.redfin.com/news/data-center/
- Redfin Research. (2025). 2026 Housing Market Predictions. https://www.redfin.com/news/housing-market-predictions-2026/
- Zillow Research. (2025). Zillow Home Value and Sales Forecast. https://www.zillow.com/research/