
Last updated: August 23, 2026

Quick Answer
Why is homeowners insurance so expensive? Blame the map. Your ZIP code, your proximity to wildfire zones, flood plains, and hurricane corridors, and the way insurers model geographic risk now drives your premium more than almost any other single factor. The average homeowners insurance cost in the United States hit roughly $2,377 per year in 2026 for a home insured at $300,000 in dwelling coverage, according to Bankrate's 2026 rate analysis, but homeowners in high-risk states routinely pay two to four times that figure. Location is not just one variable. For most policyholders, it is the variable.
Key Takeaways
- Your ZIP code is the single most powerful driver of your homeowners insurance rate increase, ahead of your credit score, claims history, or home age
- The average homeowners insurance cost in the U.S. is approximately $2,377 per year in 2026, but state-level averages range from under $800 in Hawaii to over $5,000 in some Florida counties
- Insurers use proprietary risk maps that incorporate wildfire risk, hurricane exposure, flood plain data, hail frequency, and reinsurance costs to set premiums by geographic zone
- Climate risk home insurance pricing has accelerated sharply since 2020 as reinsurers repriced catastrophe exposure globally
- Replacement cost vs. market value is a critical distinction: insurers price your policy on what it costs to rebuild, not what your home sells for
- Roof age insurance premium adjustments are among the most common and least-explained surcharges homeowners face
- Raising your deductible to lower your premium is one of the fastest ways to reduce your annual cost, but hurricane deductibles work differently than standard deductibles
- Your insurance score, a blend of credit data and claims history, affects your rate in most states
- Insurers do update their risk maps, sometimes annually, and a map reclassification can trigger a homeowners insurance rate increase with no change to your property
- Disputing your home's risk rating is possible, but it requires documentation and persistence
What Factors Make Homeowners Insurance Premiums So High
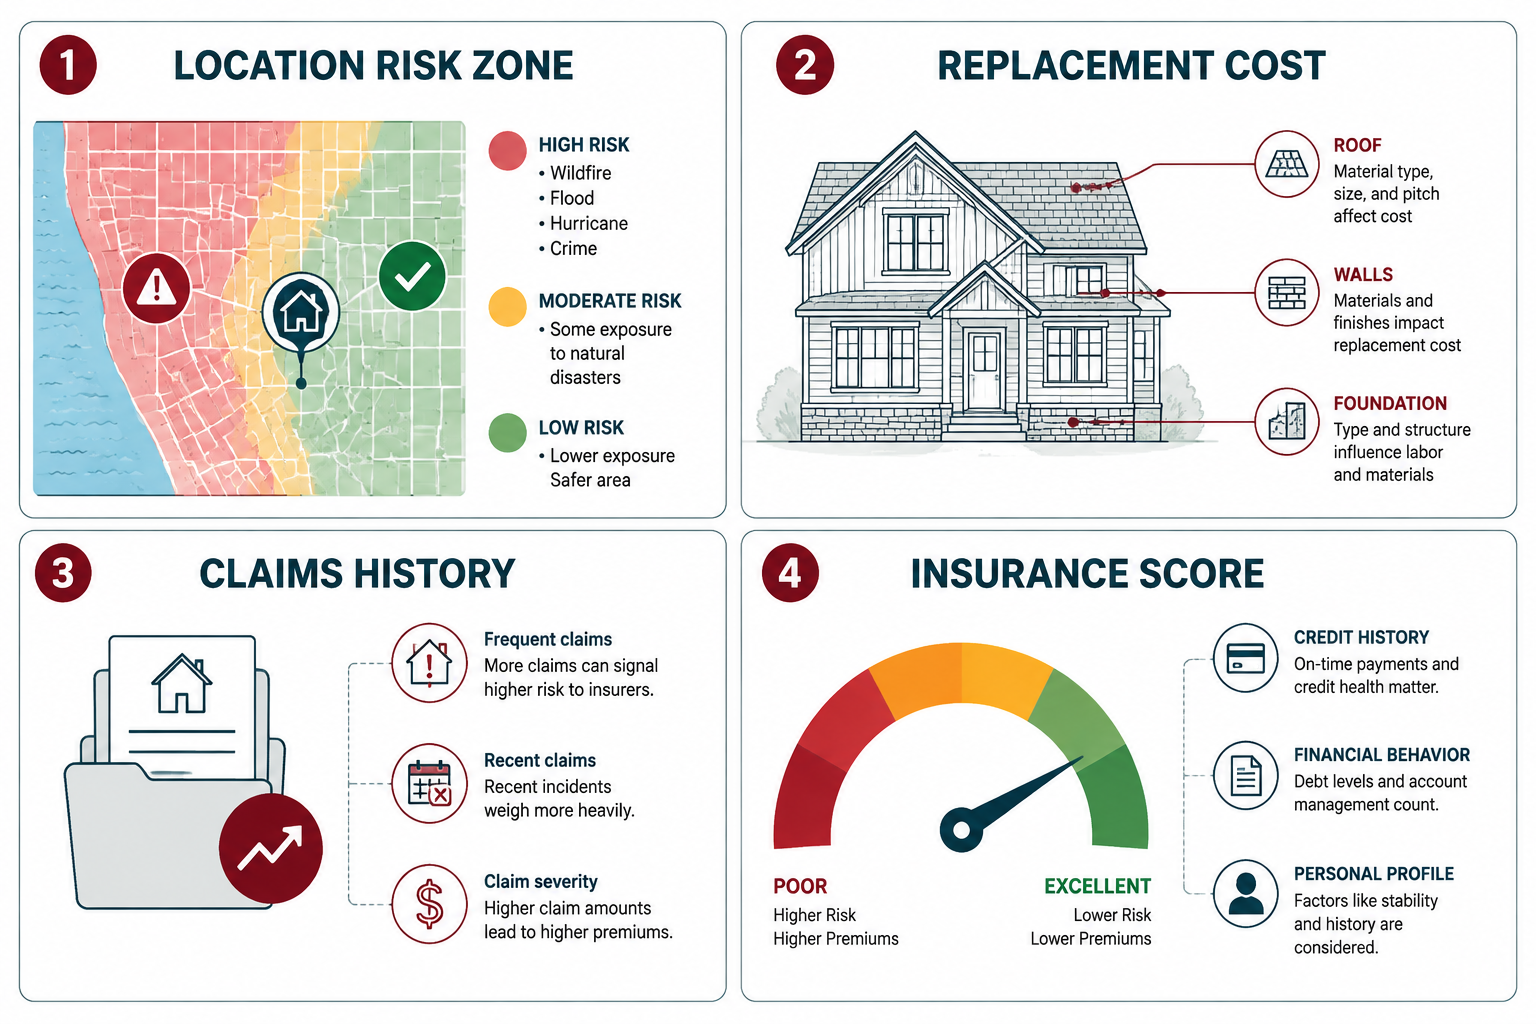
Homeowners insurance premiums are high because insurers are pricing the probability that they will have to pay a large claim, and that probability has risen sharply in the past decade. Several factors stack on top of each other to produce the bill you receive.
The primary cost drivers in 2026:
- Geographic risk zone, wildfire, hurricane, flood, hail, and tornado exposure baked into your address
- Replacement cost vs. market value, construction labor and materials inflation pushed rebuild costs up roughly 40% between 2020 and 2025, according to CoreLogic's annual construction cost index
- Roof age insurance premium adjustments, a roof over 15 years old can add 20% to 40% to your base premium or trigger a coverage limitation
- Reinsurance costs homeowners, when global reinsurers raise the price they charge insurance companies to backstop catastrophe losses, those costs pass directly to policyholders
- Your insurance score homeowners, most states allow insurers to use a credit-based insurance score, and a lower score can raise your premium by hundreds of dollars annually
- Claims history, both your personal claims history and the claims history of your neighborhood affect your rate
- Home construction type and age, masonry versus frame construction, knob-and-tube wiring, galvanized pipes, and similar factors all carry surcharges
The replacement cost vs. market value distinction catches many homeowners off guard. Your home might be worth $400,000 on the open market, but if it costs $550,000 to rebuild it with current labor and materials, your insurer is pricing the $550,000 exposure. That gap has widened every year since 2020.
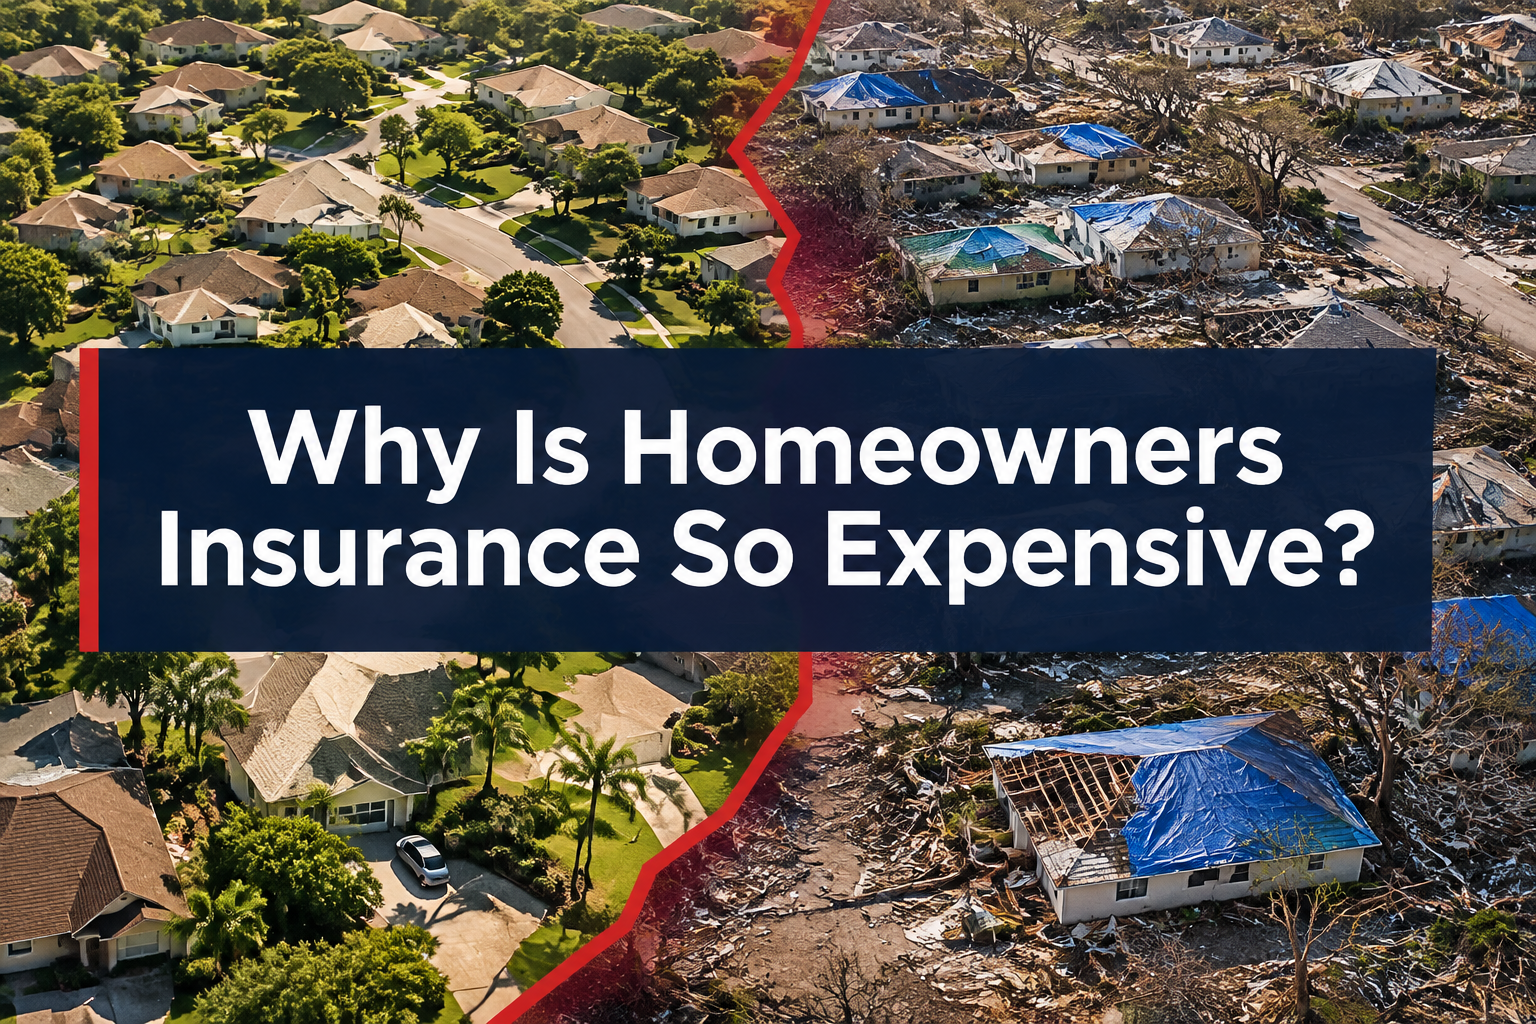
Why Is Homeowners Insurance So Expensive? Blame the Map, How Location Sets Your Rate
Location is the foundation of every homeowners insurance premium. Insurers assign every address to a risk tier based on geographic data, and that tier determines your base rate before any other factor is applied.
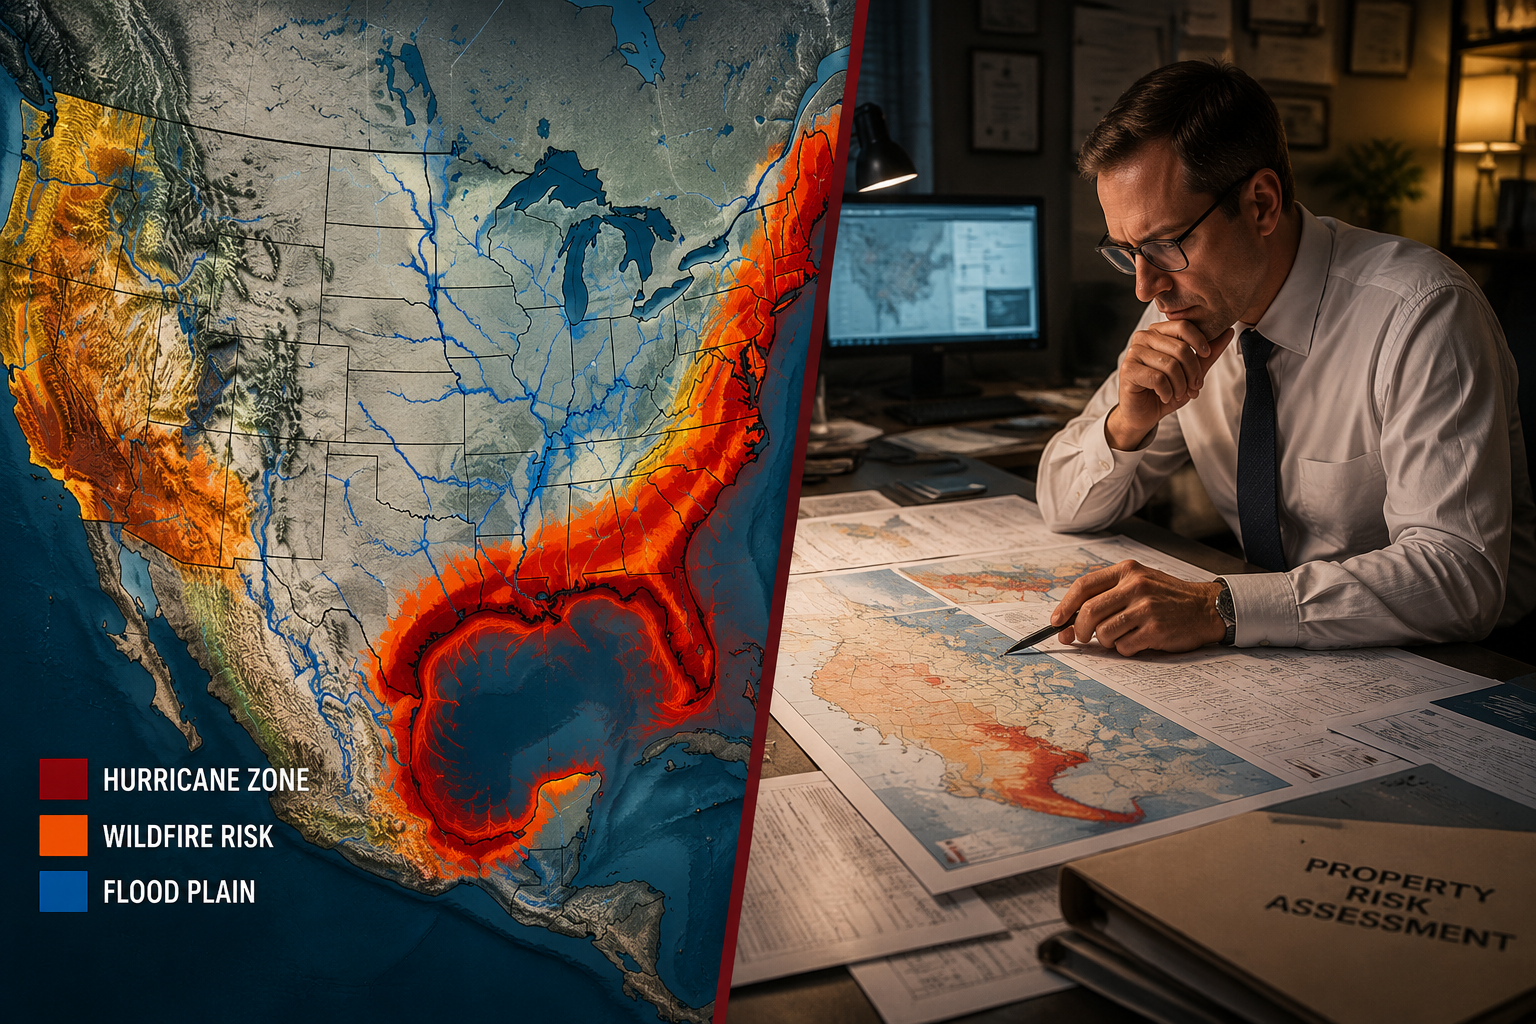
The mechanism works like this: insurers and their reinsurance partners maintain proprietary catastrophe models that score each address for its exposure to named perils. A home in Baton Rouge, Louisiana carries wildfire risk near zero but hurricane and flood risk near the top of the national scale. A home in Paradise, California carries minimal hurricane exposure but sits in one of the most extreme wildfire risk insurance premium zones in the country. A home in Tulsa, Oklahoma faces significant hail and tornado exposure. Each of those risk profiles produces a different base rate, and that base rate is almost entirely a function of the map.
Why some ZIP codes cost dramatically more than others:
- Proximity to the coast, homes within 25 miles of the Gulf Coast or Atlantic seaboard face hurricane deductibles that are separate from standard deductibles and are calculated as a percentage of the insured dwelling value, often 2% to 5%
- Wildfire interface zones, the "wildland-urban interface," where residential development meets fire-prone vegetation, now covers roughly 32% of all U.S. housing units according to the U.S. Forest Service
- Flood plain designation, FEMA flood zone classifications directly affect whether standard policies cover flooding at all, and homes in Special Flood Hazard Areas (SFHAs) face mandatory flood insurance requirements under federal lending rules
- Hail corridors, a band running from Texas through Nebraska and into the Dakotas generates more insured hail losses per square mile than almost anywhere else in the country
- Local claims density, if your neighborhood has a high concentration of recent claims, your insurer factors that into your rate even if you personally have never filed
For homeowners buying in a new market, checking the FEMA Flood Map Service Center and your state's department of insurance rate filings before closing is not optional. It is the kind of homework that can save you $3,000 a year. Our home buying hub covers the full pre-purchase checklist.
Which States Have the Most Expensive Home Insurance Cost by State
The most expensive states for homeowners insurance in 2026 are concentrated in the Gulf Coast, the Southeast, and the Great Plains. Florida, Louisiana, Oklahoma, Kansas, and Nebraska consistently rank at the top of every major insurer's rate tables.
Approximate average annual premiums by state in 2026 (Bankrate, 2026):
| State | Avg. Annual Premium | Primary Risk Driver |
|---|---|---|
| Florida | $5,100+ (varies sharply by county) | Hurricane, flood, litigation costs |
| Louisiana | $4,200+ | Hurricane, flood |
| Oklahoma | $3,800+ | Tornado, hail |
| Kansas | $3,500+ | Tornado, hail |
| Texas | $3,200+ | Hail, hurricane (coastal), tornado |
| Colorado | $2,900+ | Hail, wildfire |
| California | $2,400+ (rising fast) | Wildfire |
| Hawaii | Under $800 | Low catastrophe exposure |
| Vermont | Under $900 | Low catastrophe exposure |
Florida deserves a separate paragraph because the market there has effectively broken. Several major national carriers have stopped writing new policies in the state entirely since 2022. Citizens Property Insurance, Florida's state-backed insurer of last resort, became the largest insurer in the state, a situation that signals market failure rather than market function. Homeowners in some South Florida counties now pay more annually for insurance than they pay in property taxes.
Understanding how your location intersects with your overall cost of ownership matters enormously. For a deeper look at what these numbers mean for buyers and sellers in 2026, see our U.S. homeowners national real estate updates for 2026.
What Is Risk Mapping in Insurance and How Does It Work
Risk mapping is the process insurers use to assign a geographic risk score to every insurable property in the country. It is the core engine behind why is homeowners insurance so expensive, and it has become significantly more granular and more aggressive in the past five years.

Traditional risk mapping relied heavily on historical loss data: how many claims came from a given county or ZIP code over the past 20 years, and what did they cost. Modern catastrophe modeling goes much further. Insurers now use:
- Satellite and aerial imagery, to assess roof condition, vegetation proximity, and construction materials without a physical inspection
- FEMA flood maps and updated FEMA Risk Rating 2.0 data, which replaced the old zone-based flood pricing system in 2021 with property-specific flood risk scores
- Wildfire risk models from firms like Verisk and CoreLogic, which score each parcel based on slope, vegetation type, wind patterns, and historical fire perimeter data
- Hurricane track modeling, probabilistic models that simulate thousands of storm scenarios to estimate expected losses at each address
- Climate-adjusted forward projections, increasingly, insurers are pricing not just historical risk but projected 20-to-30-year climate risk, which is why climate risk home insurance costs are rising even in areas that have not recently experienced a major disaster
The shift to forward-looking climate models is the single biggest structural change in insurance pricing since the 1990s. An address that had acceptable historical loss data can now receive a higher risk score because the model projects that its wildfire or flood exposure will increase over the life of a 30-year mortgage.
How Do Insurance Companies Use Geographic Data to Set Prices
Insurers combine geographic risk scores with property-specific data and policyholder data to produce an individual premium. The geographic component sets the floor; everything else adjusts up or down from there.
The pricing stack, simplified:
- Base rate by geographic zone, set by the insurer's catastrophe model for your address
- Dwelling coverage amount, based on replacement cost, not market value
- Construction adjustments, frame vs. masonry, roof material, roof age insurance premium surcharges
- Personal risk factors, insurance score homeowners rating, prior claims history
- Discounts applied, home insurance discounts bundling (combining home and auto with the same carrier typically saves 5% to 25%), new construction, storm shutters, security systems, claims-free history
- Reinsurance cost pass-through, when the global reinsurance market reprices catastrophe risk, as it did sharply in 2023 and again in 2025, that cost flows into every policy renewal in affected regions
The reinsurance costs homeowners pay indirectly is worth understanding. Reinsurance is essentially insurance for insurance companies. When a hurricane causes $50 billion in losses, the primary insurers who paid those claims turn to their reinsurers to recover a portion. After major loss years, reinsurers raise their rates, and primary insurers pass those increases through to policyholders at renewal. This is why your homeowners insurance rate increase can arrive even in a year when your home had zero claims and your neighborhood was untouched by disaster.
What Role Do Climate and Weather Patterns Play in Insurance Pricing
Climate and weather patterns now directly drive insurance pricing decisions, not just after disasters but in advance of them. This is the most significant shift in how the industry operates in the past decade.
The data behind the trend is not subtle. According to NOAA's National Centers for Environmental Information, the United States recorded 28 separate billion-dollar weather and climate disasters in 2023, with total losses exceeding $92 billion. The five-year average from 2019 to 2023 was roughly 20 events per year, compared to a five-year average of about 8 events per year in the 2000s.
What this means for your premium:
- Insurers are pricing 20-to-30-year climate projections into current premiums, not just last decade's loss history
- Wildfire risk insurance premium calculations now incorporate projected vegetation changes and drought frequency, not just historical fire perimeters
- Flood risk pricing under FEMA's Risk Rating 2.0 system accounts for projected sea level rise and rainfall intensification
- Some insurers have begun using "climate stress tests" to evaluate whether a property will remain insurable at standard rates over a 10-year policy horizon
For homeowners in coastal areas, this creates a situation where the home they bought at a certain insurance cost can see that cost double or triple within five years with no physical change to the property. The map changed around them. Our piece on homeowners insurance vs. rental property insurance breaks down how these climate pricing pressures affect investors differently than owner-occupants.
What's the Difference Between High-Risk and Low-Risk Insurance Areas
High-risk insurance areas are ZIP codes or geographic zones where the probability of a large insured loss exceeds the national average by a threshold set by the insurer's model. Low-risk areas have below-average catastrophe exposure and typically produce premiums well under the national average.
The practical difference for homeowners is substantial:
High-risk area characteristics:
- Premiums often 2x to 5x the national average
- Hurricane deductibles explained as a separate percentage-based deductible (not a flat dollar amount) for named storm damage
- Flood coverage typically excluded from standard policies and requiring a separate NFIP or private flood policy
- Some carriers may refuse to write new policies entirely
- Renewal non-renewals are more common after a major loss event in the area
Low-risk area characteristics:
- Premiums near or below the national average
- Standard flat-dollar deductibles for all perils
- Flood coverage may still be excluded but is less likely to be mandatory
- Competitive carrier market with multiple options
The line between high and low risk is not always a county line. Two homes on the same street can carry different risk scores if one sits in a mapped flood plain and the other does not, or if one has a clear defensible space from vegetation and the other backs up to a wildland interface. That granularity is what makes modern risk mapping both more accurate and more frustrating for homeowners who feel the designation is arbitrary.
Why Is Homeowners Insurance So Expensive? How to Lower Your Premium
Lowering your homeowners insurance premium in a high-cost zone requires a combination of policy structure changes, property improvements, and carrier shopping. None of these are overnight fixes, but several produce results within one renewal cycle.
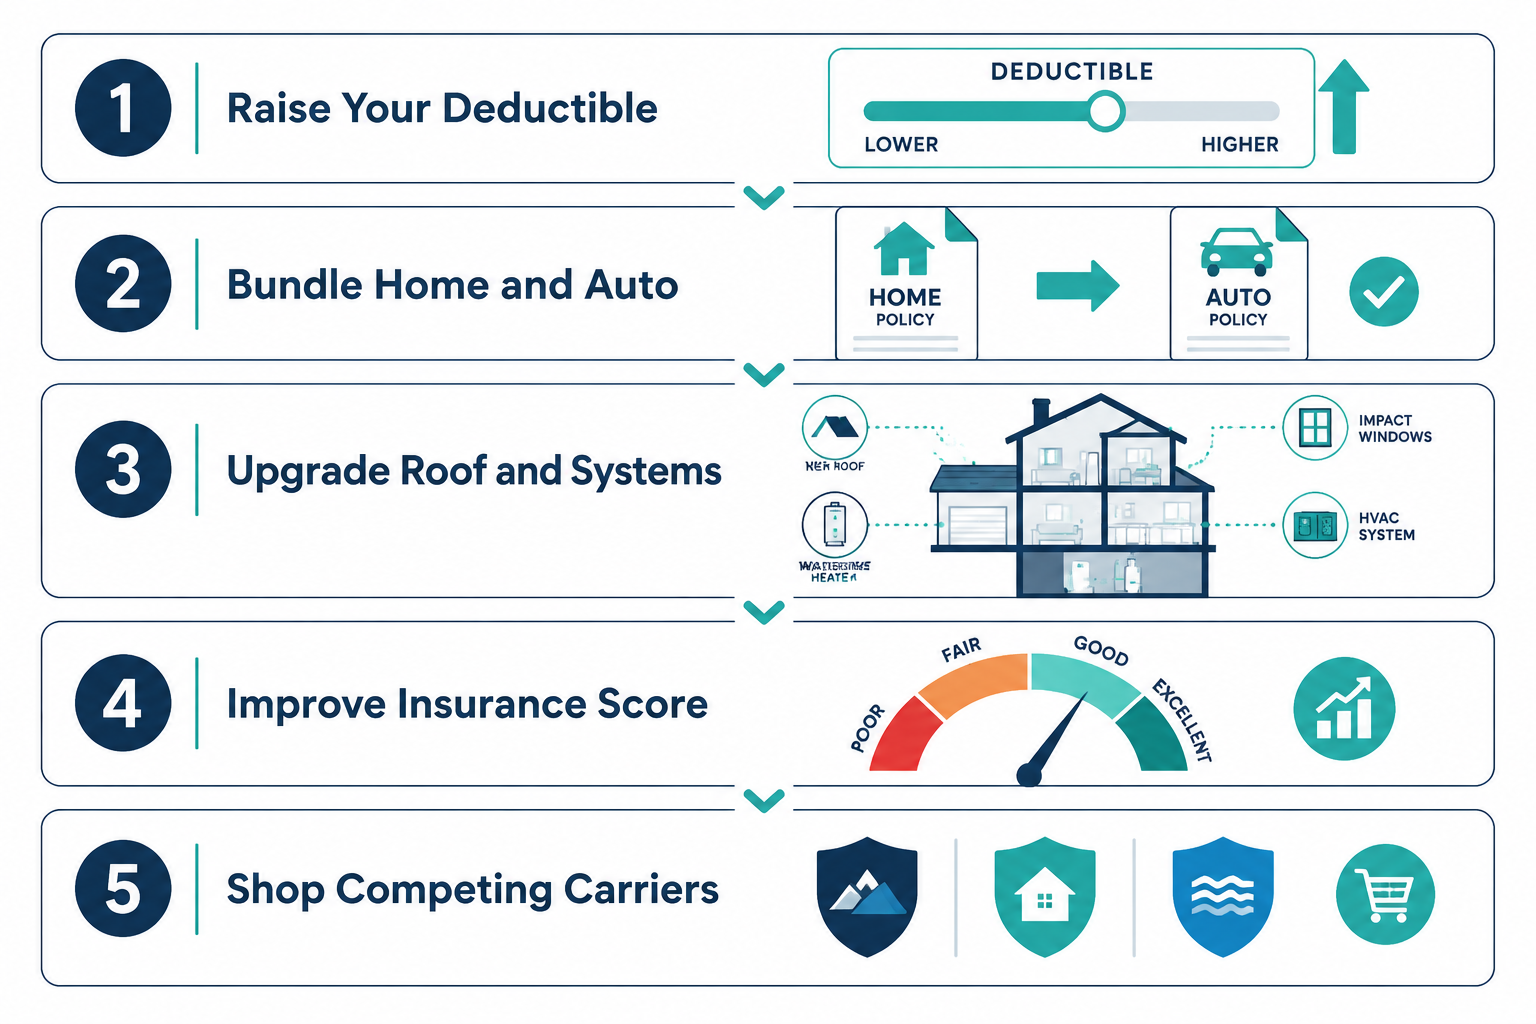
Proven strategies to reduce your annual cost:
1. Raise your deductible
Raising your deductible to lower your premium is the fastest lever available. Moving from a $1,000 to a $2,500 deductible typically reduces your annual premium by 10% to 20% depending on your carrier and state. The math only works if you have the cash reserves to cover the higher deductible in a claim scenario. Do not raise it beyond what you can actually pay out of pocket.
2. Bundle home and auto
Home insurance discounts bundling home and auto with the same carrier is one of the most consistent discounts in the industry, typically saving 5% to 25% annually. The actual savings vary by carrier, so get a bundled quote and a separate quote and compare both.
3. Improve your insurance score
Your insurance score homeowners rating is based largely on credit data in most states. Paying down revolving debt, avoiding new credit applications, and correcting errors on your credit report can improve your score and reduce your premium at the next renewal. Note that California, Maryland, and Massachusetts prohibit credit-based insurance scoring for homeowners policies.
4. Upgrade your roof
Roof age insurance premium surcharges are real and significant. Replacing a roof over 20 years old with impact-resistant materials (Class 4 shingles in hail-prone areas, or metal roofing in hurricane zones) can qualify you for discounts of 20% to 40% in some states and remove surcharges that were inflating your base rate.
5. Add storm mitigation features
In Florida and other hurricane states, a wind mitigation inspection can document features like hurricane straps, reinforced garage doors, and impact-resistant windows. Documented mitigation can reduce your wind premium by 20% to 50%.
6. Shop competing carriers annually
The insurance market is not static. Carriers enter and exit markets, and their pricing models update constantly. Getting three competing quotes at each renewal is not excessive. It is the minimum standard practice.
7. Ask about claims-free discounts
Does a claim raise your premium? Yes, in most cases. But staying claims-free for three to five years qualifies you for discounts with most carriers. Some insurers offer accident forgiveness provisions that prevent a single small claim from triggering a surcharge.
For homeowners weighing a major renovation alongside their insurance costs, our article on high-ROI home renovation ideas covers which upgrades also improve your insurability.
Do Insurance Companies Update Their Risk Maps and How Often
Yes, insurers update their risk maps, and the frequency has increased significantly since 2020. Most major carriers now update their catastrophe models annually, and some update specific peril models (particularly wildfire) on a continuous basis using satellite data.
What triggers a risk map update:
- A major catastrophe event that produces loss data exceeding model predictions
- New satellite or aerial imagery revealing changed vegetation, new construction, or infrastructure changes
- Updates to FEMA's Flood Insurance Rate Maps (FIRMs), which FEMA revises on a rolling basis by community
- Climate model updates from academic and government research incorporated by third-party catastrophe modeling firms like Verisk, RMS, and CoreLogic
- State regulatory filings that allow insurers to adopt new rating factors
The practical consequence for homeowners is that a map reclassification can produce a homeowners insurance rate increase at renewal with no physical change to your property. A neighborhood that was rated "moderate wildfire risk" in 2022 might be reclassified as "high" in 2025 based on updated vegetation modeling, and every homeowner in that zone sees their premium jump.
FEMA's flood maps are publicly accessible at msc.fema.gov. Your state's department of insurance website typically publishes the rating factors and territorial definitions that licensed insurers are permitted to use in your state, which gives you a baseline for understanding why your rate is what it is.
Can You Dispute Your Home's Insurance Risk Rating
Disputing your home's insurance risk rating is possible, but the process is specific and the burden of proof sits with the homeowner. It is not a quick phone call. It is a documentation exercise.
When a dispute is worth pursuing:
- Your home has been incorrectly mapped into a FEMA flood zone when it sits above the base flood elevation (a Letter of Map Amendment, or LOMA, can remove the mandatory flood insurance requirement)
- Your roof is newer than the insurer's records show, and you have the permit and contractor invoice to prove it
- Your wildfire defensible space has been professionally cleared and documented, but the insurer's aerial imagery predates the clearing
- Your home has storm mitigation features (hurricane straps, impact glass) that were installed after the policy was written and have not been inspected
The dispute process, step by step:
- Request your insurer's underwriting file for your property in writing. You are entitled to understand what data they used to rate your policy.
- Identify the specific factor driving the surcharge or elevated tier. Ask your agent to name it explicitly.
- Gather documentation that contradicts or updates the insurer's data: permits, inspection reports, professional assessments, photos with metadata.
- Submit a formal written dispute to the insurer's underwriting department, not just to your agent.
- If the insurer denies the dispute without a satisfactory explanation, file a complaint with your state's department of insurance. State regulators have authority over rating practices and can require the insurer to justify its methodology.
- If the issue involves a FEMA flood zone designation, the LOMA process through FEMA's Map Service Center is the correct channel and is separate from your insurer.
The documentation standard here is not bureaucratic overkill. Insurers respond to evidence, not arguments. A licensed contractor's letter stating your roof was replaced in 2024 with Class 4 impact-resistant shingles carries more weight than a conversation with your agent.
For homeowners also tracking their property's assessed value versus its insured value, our breakdown of home tax assessed value vs. market value explains how those figures interact with your overall cost picture.
FAQ
What is the average homeowners insurance cost in the U.S. in 2026?
The national average is approximately $2,377 per year for $300,000 in dwelling coverage, according to Bankrate's 2026 analysis. State averages range from under $800 in Hawaii to over $5,000 in parts of Florida.
Why did my home insurance go up if I never filed a claim?
A homeowners insurance rate increase can come from reinsurance cost increases, a risk map reclassification in your area, statewide rate filings approved by your state's department of insurance, or inflation in construction costs that raised your dwelling replacement value. None of these require a personal claim.
What is a hurricane deductible and how is it different from a standard deductible?
A hurricane deductible is a separate deductible that applies specifically to damage caused by a named tropical storm or hurricane. Unlike a standard flat-dollar deductible, hurricane deductibles are typically calculated as a percentage of your insured dwelling value, commonly 1% to 5%. On a $400,000 home, a 2% hurricane deductible means you pay the first $8,000 of any hurricane-related claim out of pocket.
Does filing a claim raise my premium?
Yes, in most cases. Filing a claim, particularly for a non-weather-related loss, can raise your premium at renewal and may affect your insurability with some carriers. Small claims under $2,000 to $3,000 are often better paid out of pocket if you can afford to, to preserve your claims-free discount.
What is an insurance score and how does it affect my rate?
An insurance score is a credit-based score used by insurers in most states to predict the likelihood of a future claim. It draws on the same underlying credit data as a traditional credit score but is weighted differently. A lower insurance score can raise your homeowners premium by $200 to $500 or more annually, depending on the carrier and state.
Can moving to a different area actually lower my insurance costs?
Yes, significantly. Moving from a high-risk coastal or wildfire zone to a low-risk inland area can cut your annual premium by 50% to 70%. This is a real factor in relocation decisions and one that more buyers are weighing explicitly in 2026. Our sell, stay, or rent it out guide covers how insurance costs factor into that broader decision.
What is replacement cost coverage and why does it matter?
Replacement cost coverage pays to rebuild your home at current construction costs, regardless of your home's market value or depreciation. Actual cash value (ACV) coverage pays the depreciated value, which can leave you significantly underinsured after a major loss. Most mortgage lenders require replacement cost coverage, and given construction cost inflation since 2020, verifying that your dwelling limit actually matches current rebuild costs is essential.
How do reinsurance costs affect my homeowners insurance premium?
Reinsurance is the coverage that primary insurers buy to protect themselves from catastrophic losses. When global reinsurance prices rise after major disaster years, primary insurers pass those costs through to policyholders at renewal. The sharp reinsurance repricing of 2023 and 2025 contributed directly to the homeowners insurance rate increases that millions of policyholders saw, even in areas with no recent local disasters.
Are there states where insurers are no longer writing new policies?
Yes. As of 2026, several major national carriers have restricted or stopped writing new homeowners policies in California, Florida, and Louisiana. State-backed insurers of last resort (California FAIR Plan, Florida Citizens, Louisiana Citizens) have absorbed policyholders who cannot find coverage in the private market, often at higher premiums and with more limited coverage.
What home improvements lower my insurance premium the most?
Roof replacement with impact-resistant materials, installation of storm shutters or impact-resistant windows, addition of a monitored security system, and water leak detection devices consistently produce the largest premium reductions. The specific discount varies by carrier and state, but a new impact-resistant roof in a hail-prone state can reduce your premium by 20% to 40%.
Conclusion
Why is homeowners insurance so expensive? The map is doing most of the work. Your address, your proximity to catastrophe zones, and the way insurers model forward-looking climate risk now determine your premium more than almost anything else about you or your home. The average homeowners insurance cost has climbed steadily for five consecutive years, and the structural forces behind that climb, reinsurance repricing, construction cost inflation, and climate-adjusted catastrophe modeling, are not going away.
That said, homeowners are not powerless. Raising your deductible, bundling policies, documenting property improvements, and shopping competing carriers at every renewal are all effective in terms of what actually moves the needle on your annual bill. If your home has been reclassified into a higher risk zone without a physical change to the property, the dispute process exists and it works when you bring the right documentation.
The real complexity of insurance pricing is exactly why treating your policy as a set-it-and-forget-it document is a mistake. Review your dwelling coverage limit against current replacement cost every year. Ask your insurer what specific factors are driving your rate. And if you are buying in a new market, check the risk map before you check the school ratings.
For buyers and sellers tracking the full cost picture in 2026, our U.S. home buyers market trends in 2026 covers how insurance costs are reshaping where people choose to buy. And if you are evaluating the total cost of homeownership before making a move, the best home buying sites in the U.S. for 2026 includes tools that now surface insurance cost estimates alongside listing prices.
Premium reductions usually take a renewal cycle or two to appear, but the steps above work.