

Last updated: October 3, 2026

Quick Answer
The Trillion-Dollar Property Bubble Expands because two giant asset pools are now moving together: a U.S. housing market that Zillow pegged at a record $55.1 trillion in residential value, and an artificial intelligence build-out absorbing hundreds of billions in annual capital expenditures. Housing itself is not uniformly overvalued: UBS found bubble risk concentrated in a handful of cities, not everywhere. The practical risk for American homeowners and investors isn't a single dramatic pop. It's a chain reaction where an AI-driven stock correction hits household wealth, hiring, and lending, and housing demand softens months later.
Key Takeaways
- Residential real estate in the United States hit a record valuation in 2025, while household net worth also set a record, per Federal Reserve data reported by Reuters.
- Bubble risk is local, not national. The UBS Global Real Estate Bubble Index 2026 places Zurich and Tokyo at the top of global risk rankings, with most U.S. metros well below them.
- AI capital spending has become macroeconomically significant, which means equity market concentration is now a housing variable, not just a Wall Street one.
- The transmission channel that matters most is employment. Property prices fall hardest when people lose income, not when sentiment sours.
- Fitch's 2026 global housing outlook still points to supply shortages supporting prices in most markets, which argues against a 2008-style collapse.
- Wealth is increasingly held in equities and home equity at the same time, so a tech drawdown and a housing slowdown can arrive together.
- Overleveraged rental deals underwritten on 2021 assumptions are the clearest point of failure, far more than owner-occupied homes with fixed-rate debt.
- Preparation beats prediction: reserves, fixed-rate debt, conservative underwriting, and honest vacancy assumptions.
What is a property bubble and how does it form?
A property bubble is a period when home prices detach from the local fundamentals that normally anchor them: incomes, rents, construction costs, and population growth. It forms when buyers start paying based on expected future appreciation rather than present-day utility or yield.
The mechanics are fairly consistent across decades and countries:
- Cheap or loose credit. Low mortgage rates, relaxed underwriting, or new loan products expand the pool of qualified buyers.
- Constrained supply. Zoning limits, labor shortages, or high construction costs prevent new inventory from meeting demand.
- Investor entry. Capital shifts from yield-seeking to appreciation-seeking. Rental math stops penciling, and buyers accept it anyway.
- Narrative reinforcement. "Prices here never fall" becomes a planning assumption rather than a slogan.
- Stress. A shock (rates, job losses, credit tightening) reveals how many buyers needed appreciation to make the deal work.
The useful diagnostic is the gap between price and income. When the UBS index flags a market, it is largely measuring price-to-income and price-to-rent multiples that would require implausible wage growth to normalize.
Common mistake: treating "expensive" as identical to "bubble." A market can be permanently expensive because of genuine scarcity. A bubble requires that prices depend on continued price increases.
How big is the global real estate bubble right now, and why does the Trillion-Dollar Property Bubble Expand beyond Wall Street?
Residential real estate is the largest asset class on earth, which is why the Trillion-Dollar Property Bubble Expands in a way that touches almost every household balance sheet. McKinsey's work on the global balance sheet describes an imbalance where asset values have grown faster than the underlying economic output supporting them, with real estate the dominant share.
Three figures frame the scale:
- U.S. residential value: a record total, driven more by price appreciation than new construction (Zillow, 2025).
- U.S. household net worth: a record high, with equities and real estate the two main drivers (Reuters on Fed data, 2026).
- Global price momentum: the Knight Frank Global House Price Index continues to show positive nominal growth across most tracked markets, though with wide dispersion.
The important nuance: the global picture is not one bubble. UBS ranks Zurich and Tokyo at elevated risk, while several previously frothy markets have cooled through a combination of higher mortgage rates and flat nominal prices. In the United States, risk clusters in metros where price-to-income ratios ran furthest ahead during 2020 to 2022, particularly parts of the Sun Belt, select mountain-west markets, and coastal condo segments carrying insurance and HOA shocks.
So the honest framing is this: a trillion-dollar property bubble exists in valuation terms and in concentration terms, but it is unevenly distributed across local real estate markets.
What causes housing prices to keep going up when affordability is this bad?
Prices keep rising primarily because supply is short and existing owners are rate-locked, not because demand is unusually strong. That combination produces low transaction volume with firm prices, which feels contradictory but is exactly what the data has shown.
The drivers worth tracking:
- Structural undersupply. Fitch's research on global housing prices and supply shortages identifies inventory constraints as the central reason prices have held up despite higher borrowing costs.
- The lock-in effect. Owners holding sub-4% mortgages have little incentive to sell, which starves the resale market of listings.
- Replacement cost. Land, labor, materials, and impact fees set a floor under new-build pricing, and new-build pricing anchors resale comps.
- Wealth concentration. Reuters' commentary that the housing ladder has become an equity ladder captures the shift: buyers increasingly need existing equity, family capital, or investment gains to enter at all.
- Institutional and cash buyers. In some suburban housing markets, all-cash purchases compete directly with financed first-time buyers.
Edge case: markets where insurance premiums have repriced sharply (parts of Florida, Louisiana, California wildfire zones) can see nominal price stagnation or decline even while national indices rise. Carrying cost, not purchase price, is doing the damage there.
How does AI spending actually reach the U.S. housing market?
AI capital expenditure reaches housing through four channels: GDP and job creation, equity-driven household wealth, interest rates, and localized construction and rental demand near data center corridors. Each channel can run in reverse.
On the way up:
- CapEx as growth. Capital expenditures (CapEx) are the money hyperscalers (the largest cloud operators, including Microsoft, Amazon, Alphabet, and Meta) spend on durable assets: chips, servers, buildings, cooling, and power. When that spending reaches a meaningful share of GDP growth, it supports employment and tax receipts.
- The wealth effect. When retirement accounts and index funds appreciate, households feel richer and bid more aggressively on homes, second homes, and rental property.
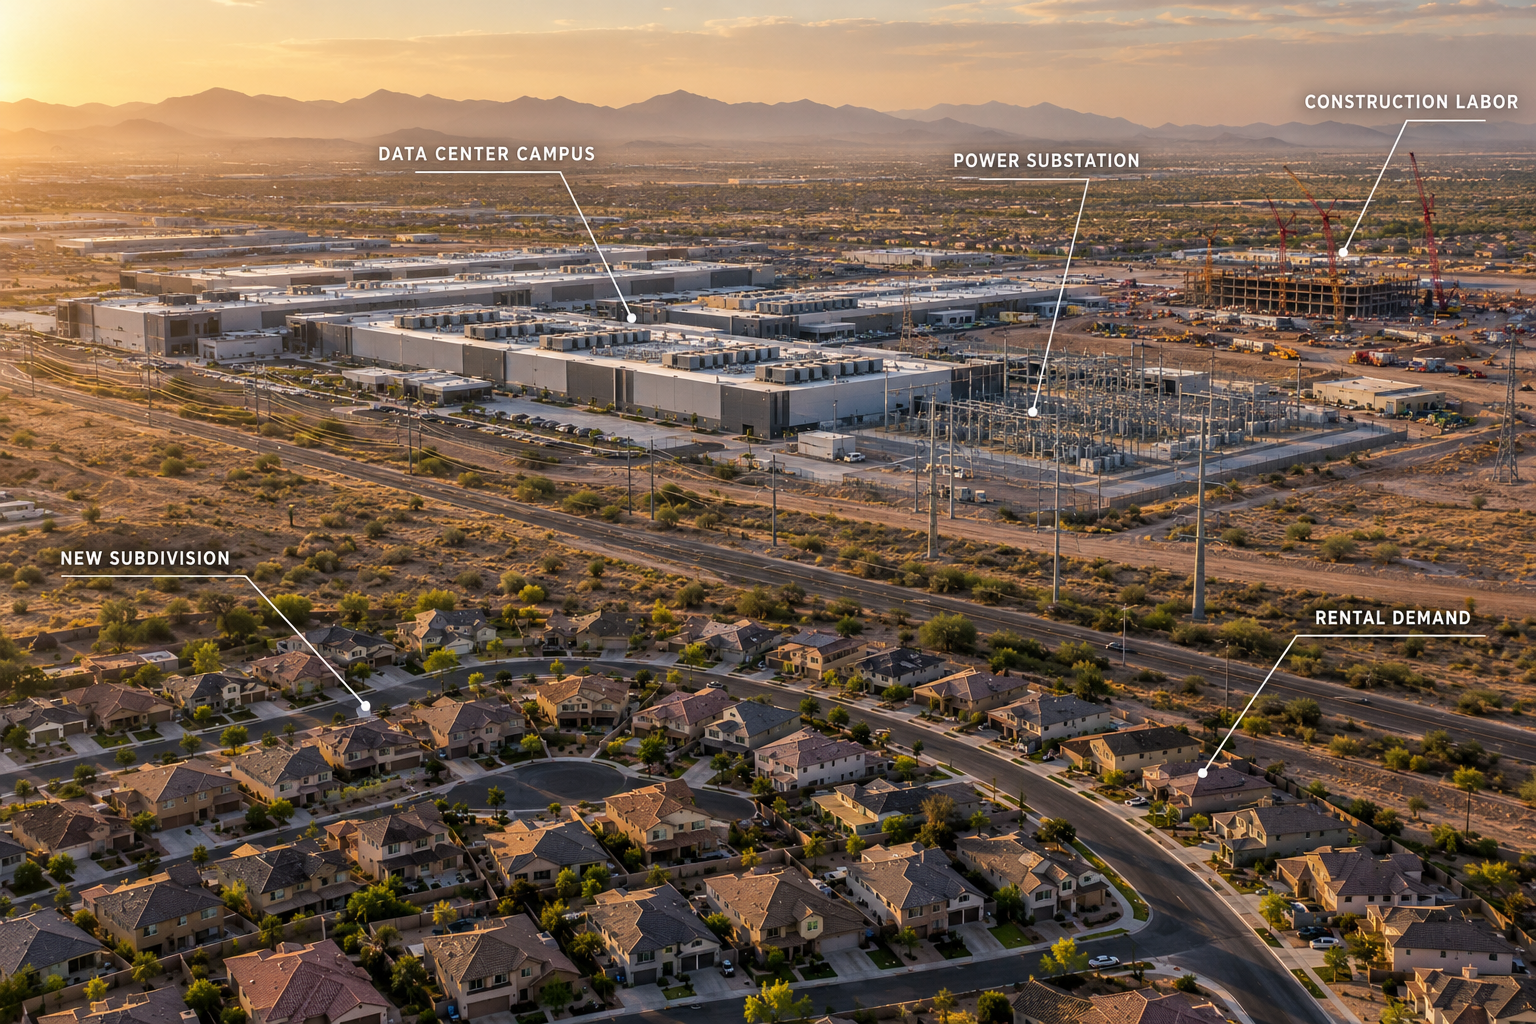
- Local build-out. Data center clusters in Northern Virginia, central Ohio, Phoenix, Atlanta, and parts of Texas have pulled in construction labor, electricians, and operations staff, which tightens nearby rental markets.
- Commercial repricing. Industrial land near transmission capacity has become a premium asset class.
On the way down:
- Revenue shortfall. Several leading AI developers are burning cash at scale while projecting steep revenue growth. If growth undershoots, CapEx plans get cut first.
- Capex cuts hit employment. A single paused data center campus removes hundreds of construction jobs from a local economy, often in markets where new apartment supply was built on the assumption those workers would stay.
- Equity drawdown hits confidence. Portfolio losses reduce down-payment capacity and investor risk appetite within a quarter or two.
- Credit tightening. Lenders respond to macro stress by raising debt service coverage requirements, which cools investor acquisitions.
Decision rule: if you're underwriting a rental in a metro where more than a small share of recent job growth came from one data center or one chip facility, model a scenario where that pipeline stops. Not because it will, but because single-employer concentration is a real underwriting risk.
Is this another dot-com bubble?
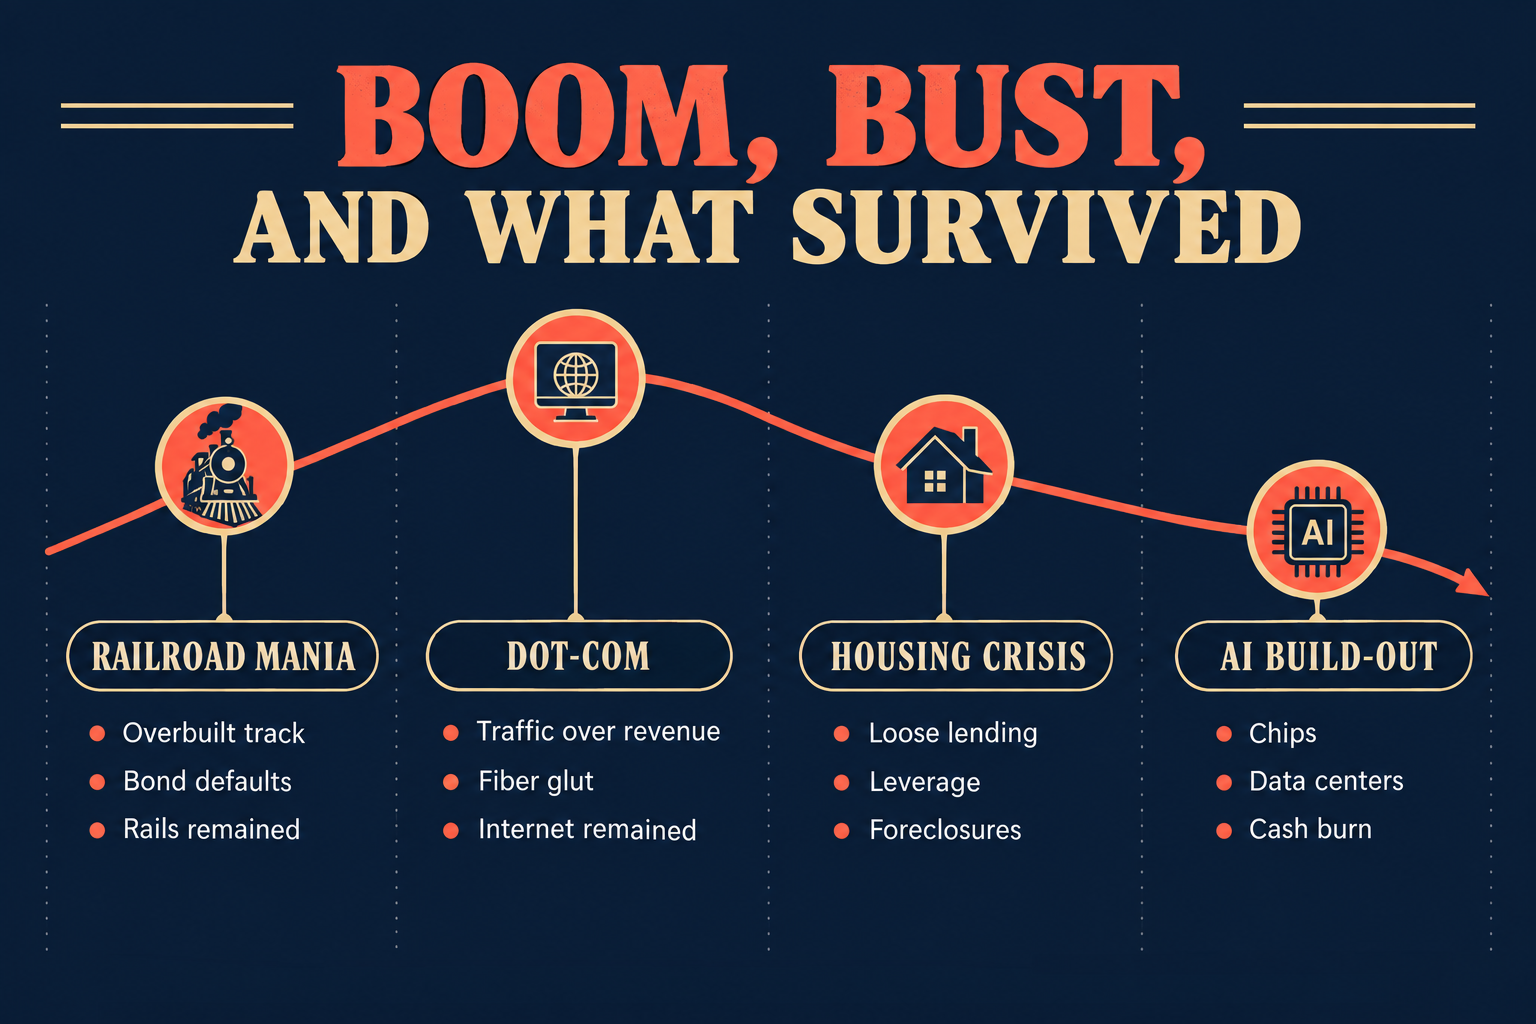
The closest historical analogues are the railroad manias of the 1800s and the dot-com bubble of the late 1990s, and both carry the same lesson: a technology can be genuinely transformative while its financing still produces enormous investor losses.
| Episode | What was real | What broke | What survived |
|---|---|---|---|
| Railroad mania | Rail genuinely reshaped commerce | Overbuilt routes, bond defaults | The track network |
| Dot-com | The internet genuinely reshaped life | Valuations priced on traffic, not profit | Fiber, Amazon, the web |
| 2008 housing | Homeownership demand was real | Leverage and credit quality | The housing stock |
| AI build-out | Productivity gains appear real | Cash burn vs. projections, concentration | Compute capacity, models |
Two distinctions matter for today's AI investment bubble debate:
- The capital is better funded. Much of the current build-out is financed by profitable operating businesses rather than speculative IPO proceeds, which reduces the odds of a sudden financing freeze.
- The concentration is heavier. A small number of companies, including Nvidia as the dominant chip supplier, account for an outsized share of index gains. That means a correction in a few names hits broad index funds and retirement accounts held by ordinary American households.
So: plausibly a bubble in valuation, less plausibly a repeat of 2000's financing structure, and the real estate exposure is indirect rather than direct.
Will the property bubble burst in 2026, and what are the warning signs?
A nationwide U.S. housing crash in 2026 is not the base case in most published outlooks, mainly because supply remains tight and lending standards since 2010 have been far stricter than pre-2008. A regional correction in the most overextended metros is considerably more likely than a national collapse.
Watch these indicators, in rough order of usefulness:
- Initial jobless claims and tech layoff announcements. Employment is the main transmission channel from a tech correction to housing.
- Months of supply by metro. Above roughly six months signals a buyer's market; above nine suggests price declines.
- Price cuts as a share of active listings. Rising cuts precede median price declines by several months.
- Rent growth turning negative. Especially in markets that delivered heavy multifamily supply in 2024 and 2025.
- Rental vacancy rates climbing while concessions (free months, waived fees) spread.
- Hyperscaler CapEx guidance. Announced reductions in data center spending are a leading indicator for the construction-heavy metros.
- Credit spreads widening on commercial mortgage-backed securities and on AI-related corporate debt.
Quick example: a Phoenix investor tracking these signals in sequence would see tech layoffs, then softer rent growth, then rising concessions, then price cuts, before median prices moved. That sequence buys time to refinance, build reserves, or reduce exposure.
How does a real estate crash affect the broader economy?
A housing downturn transmits through construction employment, consumer spending, bank balance sheets, and state and local tax revenue. Housing is unusually potent because it is both a large employer and the primary store of household wealth.
The chain typically runs:
- Transactions slow, so agent, lender, title, and inspection income falls.
- Builders pause projects, removing construction jobs quickly.
- Household spending contracts as home equity shrinks (the wealth effect in reverse).
- Property tax bases flatten, pressuring municipal budgets and services.
- Banks tighten lending broadly, which slows business investment.
Severity depends on leverage. The 2008 crisis was catastrophic because the mortgage credit system itself was impaired. A valuation-driven correction without widespread default looks more like 1990 or 2008's Canadian experience: painful, slow, survivable.
How do today's property bubbles compare to the 2008 financial crisis?
The key structural difference is borrower quality. In 2006, a large share of U.S. mortgages were adjustable-rate, low-documentation, or negative-amortization loans. Today the dominant product is a 30-year fixed mortgage issued to a well-documented borrower with meaningful equity.
Comparison on the factors that actually caused 2008:
- Underwriting: then, minimal verification; now, full documentation and ability-to-repay rules.
- Rate structure: then, heavy ARM resets; now, mostly fixed-rate, with a large cohort locked below 4%.
- Equity position: then, widespread near-zero and negative equity; now, historically high aggregate home equity.
- Supply: then, a construction glut; now, a persistent shortfall in most metros.
- Exposure: then, bank balance sheets; now, more exposure sits with equity investors and private credit.
That's why a 2026 downturn would more likely resemble a grinding affordability stall (flat nominal prices, falling real prices, low volume) than a foreclosure cascade. The exception is heavily leveraged investor-owned rentals and short-term rental portfolios bought at peak pricing with floating-rate or bridge debt.
Which cities and regions are most at risk?
Risk concentrates where price-to-income ratios ran furthest ahead of local wages, where new supply landed heavily, or where carrying costs have repriced. UBS's 2026 index places Zurich and Tokyo at the top of global bubble risk, with Miami and Los Angeles among the higher-risk U.S. entries historically tracked in the series.
Higher-risk categories in the United States:
- Pandemic-boom Sun Belt markets with large 2024 to 2025 multifamily deliveries: Austin, Phoenix, Nashville, parts of Florida.
- Insurance-stressed coastal markets where premiums and HOA assessments have reset dramatically.
- Single-employer or single-industry metros, including towns whose recent growth depends on one data center or fabrication plant.
- Short-term rental saturated markets in mountain and beach destinations.
Lower-risk categories:
- Supply-constrained Midwest and Northeast metros with modest price-to-income ratios and limited new construction.
- Diversified major metro areas with healthcare, government, education, and logistics employment bases.
Decision rule: choose markets where the rent you need to charge is already affordable on local median income. If your pro forma rent requires above-median income from a renter, your margin of safety is thin.
Should I buy a house before the bubble pops, and what happens to my home value in a downturn?
If you plan to hold for seven years or longer, can afford the payment on current income without relying on future rent increases or appreciation, and have reserves, buying is defensible regardless of where we sit in the cycle. If you're buying because you fear being priced out forever, that's the sentiment phase of a bubble talking.
What typically happens to home values in a correction:
- Nominal declines are usually far smaller than headlines suggest outside the worst-hit metros.
- Real (inflation-adjusted) declines can be substantial and prolonged even when nominal prices hold flat.
- Entry-level and well-located homes tend to hold value better than luxury, condo, and speculative new construction.
- Losses are only realized if you sell or need to refinance at a lower valuation.
Practical guidance on the buy-versus-wait question:
- Buy if: stable income, long hold horizon, fixed-rate financing, reserves of at least six months of payments, and the home works for your life for several years.
- Wait if: job security is shaky, you'd be stretching past roughly a third of gross income, you have minimal reserves, or you might relocate within three years.
- Either way: compare the full carrying cost (mortgage, taxes, insurance, maintenance, HOA) against renting the same property, not against renting something smaller.
For a deeper look at how rate expectations are shaping strategy this year, see our breakdown of 2026 real estate trends under stable 6% rates and the comparison of 15-year versus 30-year mortgage rates.
How do interest rates affect the property bubble?
Interest rates set the price of leverage, so they directly determine how much house a given income can buy. Each percentage point change in mortgage rates moves affordability more than most buyers expect, which is why rate paths matter more to prices than headlines about supply.
The mechanics:
- Rising rates compress purchasing power, cool transaction volume, and eventually pressure prices, though lock-in effects delay the price response.
- Falling rates can reignite bidding wars quickly because pent-up demand is large and inventory is thin. Rate cuts are not automatically good news for affordability.
- AI-driven capital demand is itself a rate variable. Enormous borrowing to fund data centers and power infrastructure competes for capital and can keep long-term yields, including the 10-year Treasury that guides mortgage pricing, higher than growth alone would imply.
- Adjustable-rate exposure is the pressure point for investors. If you hold floating-rate or bridge debt, model a scenario where rates stay elevated longer than your business plan assumes. Our rundown on adjustable-rate mortgage trade-offs covers the specifics.
What should homeowners do now?
Homeowners with fixed-rate mortgages and stable employment are in a structurally strong position and generally should not act on bubble headlines. The priority is liquidity and avoiding decisions that convert paper equity into obligation.
A short checklist:
- Keep fixed-rate debt fixed. Don't trade a low fixed rate for a variable product to access equity.
- Be cautious with cash-out refinancing and HELOCs. Drawing equity to fund consumption or speculative purchases is the fastest way to turn a price dip into real financial stress.
- Build or restore reserves to cover six to twelve months of housing costs plus essentials.
- Know your local fundamentals, not the national narrative: months of supply, days on market, price cuts, and the largest employers in your county.
- Reassess insurance annually. Premium increases have become a larger threat to affordability than price declines in several coastal states.
- Skip renovations priced on appreciation. Focus on projects with durable resale value; our list of high-ROI renovations is a reasonable filter.
What should real estate investors do next as the Trillion-Dollar Property Bubble Expands?
As the Trillion-Dollar Property Bubble Expands, the highest-value action for rental property investors is stress-testing existing holdings rather than predicting the top. Underwrite for the scenario you'd hate, then decide whether you still own a viable asset.
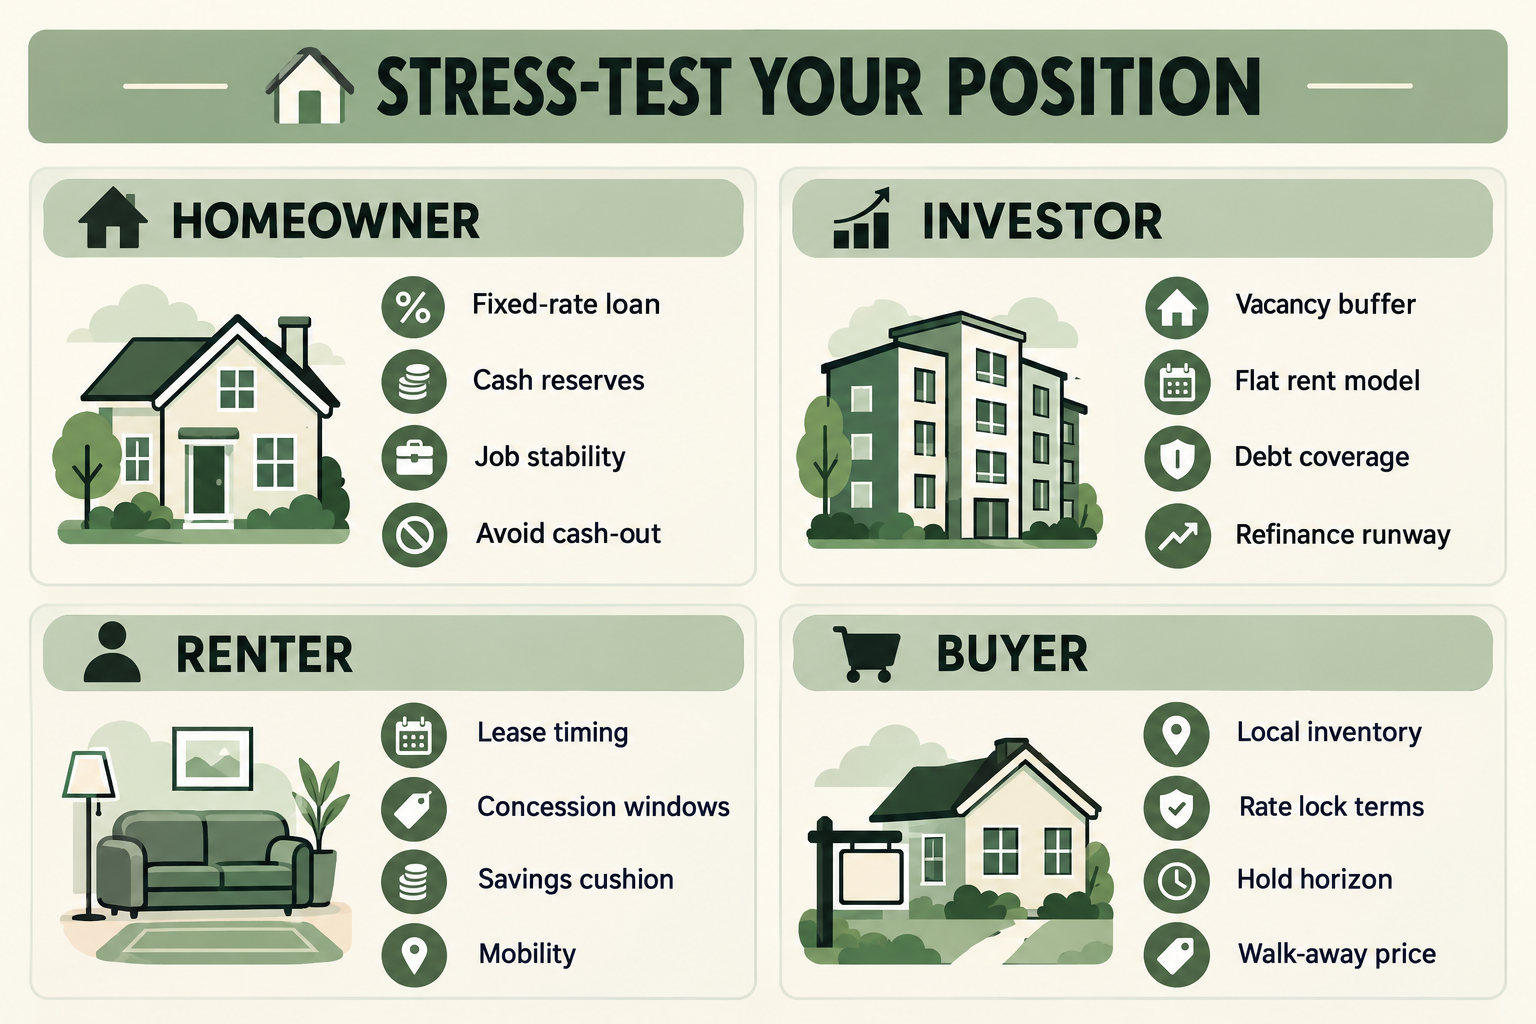
Stress-test every property against these assumptions:
- Vacancy at double your current rate, or at least 8% to 10% depending on your submarket.
- Zero rent growth for 24 months. If the deal only works with 4% annual rent increases, it isn't a deal.
- Insurance up 20% to 40% at renewal, plus property tax reassessment.
- Refinance at a rate 150 basis points above today's, if you have debt maturing within three years.
- A 10% to 15% drop in property values, and check whether that breaks loan-to-value covenants.
Risk management priorities:
- Reduce leverage on the weakest asset first. The marginal property that barely cash flows is the one that forces a bad sale.
- Term out short debt. Bridge and floating-rate loans are the primary failure mode in a slow correction.
- Hold real reserves per door, not a single lump covering an entire portfolio.
- Diversify employer exposure. A portfolio where every tenant works for the same industry carries hidden correlation.
- Favor cash flow over appreciation thesis. Appreciation is a bonus, not a business model.
- Understand your financing options. Compare DSCR loan lenders and know the terms before you need them.
Is it still a good time to invest? Yes, selectively. Deals that work on today's rents, today's rates, and conservative vacancy assumptions exist in most regions. What doesn't work is paying 2021 prices on 2026 financing while hoping for 2021 rent growth. For structured tax-efficient repositioning, the 1031 exchange rules and timelines are worth knowing before you list anything.
How can renters and first-time buyers prepare?
Renters gain negotiating power in exactly the markets with the most new supply, so the near-term opportunity is concentrated in Sun Belt metros that delivered large apartment pipelines. Buyers should focus on reserve-building and avoiding stretch purchases rather than timing a bottom.
For renters:
- Negotiate at renewal in high-supply markets. Concessions like a free month or waived fees are common where vacancy has risen.
- Consider longer lease terms if rent is flat or declining and you want cost certainty.
- Keep savings liquid. Housing downturns correlate with job market stress, and three to six months of expenses matters more than a slightly better entry price.
For first-time buyers:
- Get fully underwritten, not just pre-qualified, before shopping.
- Target a payment below what you qualify for. Lenders approve based on ratios, not on your actual resilience.
- Avoid waiving inspections or appraisal protections. In a softening market, those protections have real value, and roughly one in ten deals runs into an appraisal gap.
- Don't drain reserves for the down payment. A smaller down payment with cash in the bank is often safer than the reverse.
Who benefits from rising property prices, and who gets hurt?
Rising prices benefit existing owners, lenders, institutional landlords, and local governments collecting property tax. They hurt first-time buyers, renters, and anyone whose wages aren't rising with asset prices.
Winners:
- Homeowners with equity and fixed-rate debt.
- Investors who bought earlier in the cycle at lower bases.
- Mortgage lenders, brokers, and title firms during high-volume periods.
- Municipalities with growing tax bases.
Losers:
- First-time buyers, who now frequently need family capital or equity from a prior sale, the dynamic Reuters describes as the equity ladder.
- Renters in supply-constrained markets, where rent growth outpaces wages.
- Younger households facing a record-high average first-time buyer age.
- Communities where essential workers can no longer afford to live near their jobs.
That distributional split is the political engine behind housing policy debates, and it's why affordability pressure eventually produces regulatory responses, from zoning reform to investor purchase restrictions.
Why do AI regulation and transparency matter to property markets?
Regulation matters because when one industry becomes a significant driver of GDP growth, equity index performance, and construction activity, its internal risk decisions stop being private. They become everyone's exposure, including homeowners who have never bought a tech stock.
The governance concerns raised by current and former researchers at leading AI labs center on a few themes:
- Competitive pressure overriding caution. When slowing down costs market share, no single company can slow down unilaterally, which is the standard argument for coordinated rules.
- Self-regulation and regulatory capture. When the largest incumbents help write the rules, those rules can raise barriers to entry while doing little about actual safety. Calls for industry-wide regulation from dominant players deserve scrutiny on both counts.
- Disclosure quality. Investors, including pension funds holding retirement assets, need clear reporting on AI revenue, cash burn, depreciation schedules on rapidly obsolescing hardware, and circular vendor financing arrangements.
- Capital concentration and antitrust. A handful of firms controlling chips, cloud capacity, and models creates single points of failure for broad index funds.
- Energy and infrastructure. Data center power demand is already affecting utility planning and electricity rates in several states, which feeds directly into housing costs.
None of that tells you whether to buy a duplex this quarter. It does explain why a technology policy question now sits upstream of your mortgage rate.
FAQ
Is the U.S. housing market in a bubble in 2026?
Parts of it. Price-to-income ratios are stretched in specific Sun Belt and coastal metros, but national lending standards are strict and inventory remains tight, which argues against a broad bubble.
What's the single best early warning sign of a housing downturn?
Rising months of supply combined with an increasing share of listings cutting price. Both move before median prices do.
Could an AI stock correction actually cause home prices to fall?
Indirectly, yes. The path runs through job losses, reduced household wealth, tighter lending, and weaker buyer demand, typically with a lag of two to four quarters.
How much should I keep in reserves as a landlord?
A common standard is three to six months of full operating costs and debt service per property, held in cash or near-cash, not in a HELOC you may lose access to.
Are home prices expected to fall in 2026?
Most published outlooks, including Fitch's, still point to modest nominal growth globally on supply shortages, with declines concentrated in specific overextended markets rather than nationally.
Should I sell my rental property now?
Only if it fails your own stress test: negative cash flow at realistic vacancy, near-term debt maturity you can't refinance, or concentration in a single fragile employer market.
Does a trillion-dollar property bubble mean a 2008 repeat?
No. The 2008 crisis was a credit event driven by poor underwriting and adjustable-rate resets. Today's risk is more about valuation, affordability, and leverage in investor-held assets.
What happens to my mortgage if home values fall?
Nothing changes about the loan itself. Your payment and terms stay the same on a fixed-rate mortgage. The practical issue is reduced refinancing or selling flexibility.
Are data center towns good places to invest?
They can be, but treat them as single-employer markets. Model what happens if the build-out pauses, and prefer metros where data centers add to a diversified base rather than define it.
How do I protect a portfolio from a real estate downturn?
Fixed-rate long-term debt, reserves per property, conservative underwriting, employer and geographic diversification, and avoiding deals that need appreciation to succeed.
Final Takeaway: The Trillion-Dollar Property Bubble Expands, but Preparation Matters
The Trillion-Dollar Property Bubble Expands as record housing valuations and unprecedented AI infrastructure spending become increasingly linked, which means the next housing cycle may be set in motion by a data center spending decision rather than a mortgage rate. That link is new, and most household financial plans don't account for it.
None of this means a crash is guaranteed. Artificial intelligence may generate real productivity gains, supply shortages continue to support prices in most regions, and lending standards are far healthier than in 2006. But "probably fine" is not a plan.
What to actually do:
- Watch local fundamentals (supply, employer mix, rent trends), not national headlines.
- Protect cash flow and keep genuine reserves.
- Keep debt fixed and long where possible.
- Underwrite new deals on today's numbers, with no appreciation assumption.
- Avoid overleverage, especially on your weakest asset.
The Trillion-Dollar Property Bubble Expands in both directions: the upside case is real, and so is the downside. Build a position that survives either one, and you don't need to guess which arrives first.
References
- UBS Global Real Estate Bubble Index 2026 – UBS, 2026
- UBS Global Real Estate Bubble Index 2026: Zurich and Tokyo lead global housing bubble risk – UBS, 2026
- Breakingviews: The housing ladder is now an equity ladder – Reuters, 2026
- The global balance sheet 2026: Imbalance and divergence – McKinsey Global Institute, 2026
- 2026 Global Housing and Mortgage Outlook Mid-Year Update – Fitch Ratings, 2026
- Global Housing Prices to Rise on Supply Shortages – Fitch Ratings, 2025
- Global House Price Index Q1 2026 – Knight Frank, 2026
- US housing market reaches record $55.1 trillion – Zillow, 2025
- US household wealth hit record in third quarter 2025, Fed data shows – Reuters, 2026